Collaborative Innovation Center on Forecast and Evaluation of Meteorological Disasters, Nanjing University of Information Science & Technology, Nanjing 210044, China.
Key Laboratory of Digital Earth Science, Institute of Remote Sensing and Digital Earth, Chinese Academy of Sciences, Beijing 100094, China.
Sensors (Basel). 2018 Sep 30;18(10):3290. doi: 10.3390/s18103290.
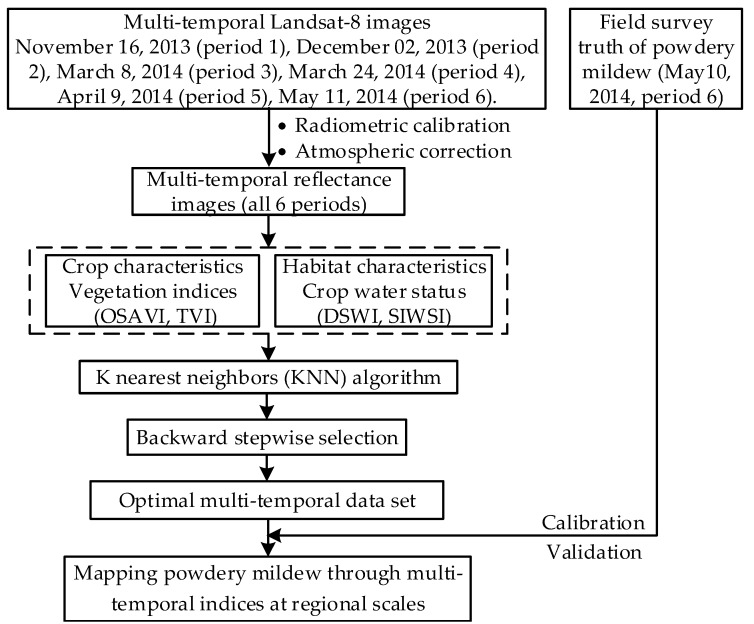
Powdery mildew is one of the dominant diseases in winter wheat. The accurate monitoring of powdery mildew is important for crop management and production. Satellite-based remote sensing monitoring has been proven as an efficient tool for regional disease detection and monitoring. However, the information provided by single-date satellite scene is hard to achieve acceptable accuracy for powdery mildew disease, and incorporation of early period contextual information of winter wheat can improve this situation. In this study, a multi-temporal satellite data based powdery mildew detecting approach had been developed for regional disease mapping. Firstly, the Lansat-8 scenes that covered six winter wheat growth periods (expressed in chronological order as periods 1 to 6) were collected to calculate typical vegetation indices (VIs), which include disease water stress index (DSWI), optimized soil adjusted vegetation index (OSAVI), shortwave infrared water stress index (SIWSI), and triangular vegetation index (TVI). A multi-temporal VIs-based -nearest neighbors (KNN) approach was then developed to produce the regional disease distribution. Meanwhile, a backward stepwise elimination method was used to confirm the optimal multi-temporal combination for KNN monitoring model. A classification and regression tree (CART) and back propagation neural networks (BPNN) approaches were used for comparison and validation of initial results. VIs of all periods except 1 and 3 provided the best multi-temporal data set for winter wheat powdery mildew monitoring. Compared with the traditional single-date (period 6) image, the multi-temporal images based KNN approach provided more disease information during the disease development, and had an accuracy of 84.6%. Meanwhile, the accuracy of the proposed approach had 11.5% and 3.8% higher than the multi-temporal images-based CART and BPNN models', respectively. These results suggest that the use of satellite images for early critical disease infection periods is essential for improving the accuracy of monitoring models. Additionally, satellite imagery also assists in monitoring powdery mildew in late wheat growth periods.
白粉病是冬小麦的主要病害之一。准确监测白粉病对于作物管理和生产至关重要。基于卫星的遥感监测已被证明是一种有效的区域病害检测和监测工具。然而,单日期卫星场景提供的信息很难实现对白粉病的可接受的准确性,并且结合冬小麦的早期背景信息可以改善这种情况。在本研究中,开发了一种基于多时相卫星数据的白粉病检测方法,用于区域病害制图。首先,收集了覆盖六个冬小麦生长时期(按时间顺序表示为时期 1 到 6)的 Landsat-8 场景,以计算典型的植被指数(VIs),包括病害水分胁迫指数(DSWI)、优化土壤调整植被指数(OSAVI)、短波红外水分胁迫指数(SIWSI)和三角植被指数(TVI)。然后,基于多时相 VIs 的最近邻(KNN)方法用于生成区域病害分布。同时,使用向后逐步消除方法来确认 KNN 监测模型的最佳多时相组合。分类回归树(CART)和反向传播神经网络(BPNN)方法用于比较和验证初始结果。除了第 1 期和第 3 期之外,所有时期的 VIs 都为冬小麦白粉病监测提供了最佳的多时相数据集。与传统的单日期(第 6 期)图像相比,基于多时相图像的 KNN 方法在病害发展过程中提供了更多的病害信息,准确率为 84.6%。同时,与传统的单日期(第 6 期)图像相比,基于多时相图像的 KNN 方法在病害发展过程中提供了更多的病害信息,准确率为 84.6%。同时,与传统的单日期(第 6 期)图像相比,基于多时相图像的 KNN 方法在病害发展过程中提供了更多的病害信息,准确率为 84.6%。同时,与传统的单日期(第 6 期)图像相比,基于多时相图像的 KNN 方法在病害发展过程中提供了更多的病害信息,准确率为 84.6%。同时,该方法的准确率比基于多时相图像的 CART 和 BPNN 模型分别高 11.5%和 3.8%。这些结果表明,使用卫星图像监测早期关键病害感染期对于提高监测模型的准确性至关重要。此外,卫星图像还可以帮助监测冬小麦生长后期的白粉病。