• 文献检索
  • 文档翻译
  • 深度研究
  • 学术资讯
  • Suppr Zotero 插件Zotero 插件
  • 邀请有礼
  • 套餐&价格
  • 历史记录
应用&插件
Suppr Zotero 插件Zotero 插件浏览器插件Mac 客户端Windows 客户端微信小程序
定价
高级版会员购买积分包购买API积分包
服务
文献检索文档翻译深度研究API 文档MCP 服务
关于我们
关于 Suppr公司介绍联系我们用户协议隐私条款
关注我们

Suppr 超能文献

核心技术专利:CN118964589B侵权必究
粤ICP备2023148730 号-1Suppr @ 2026

文献检索

告别复杂PubMed语法,用中文像聊天一样搜索,搜遍4000万医学文献。AI智能推荐,让科研检索更轻松。

立即免费搜索

文件翻译

保留排版,准确专业,支持PDF/Word/PPT等文件格式,支持 12+语言互译。

免费翻译文档

深度研究

AI帮你快速写综述,25分钟生成高质量综述,智能提取关键信息,辅助科研写作。

立即免费体验

一个用于创建、修改和可视化多层图的R包。

: An R Package to Create, Modify and Visualize Multilayered Graphs.

作者信息

Hammoud Zaynab, Kramer Frank

机构信息

Department of Medical Statistics, University Medical Center Göttingen, Humboldtallee 32, 37073 Göttingen, Germany.

Institute of Computer Science, IT Infrastructure for Translational Medical Research, University of Augsburg, Universitätsstraße 6a, 86159, Augsburg, Germany.

出版信息

Genes (Basel). 2018 Oct 23;9(11):519. doi: 10.3390/genes9110519.

DOI:10.3390/genes9110519
PMID:30360563
原文链接:https://pmc.ncbi.nlm.nih.gov/articles/PMC6267209/
Abstract

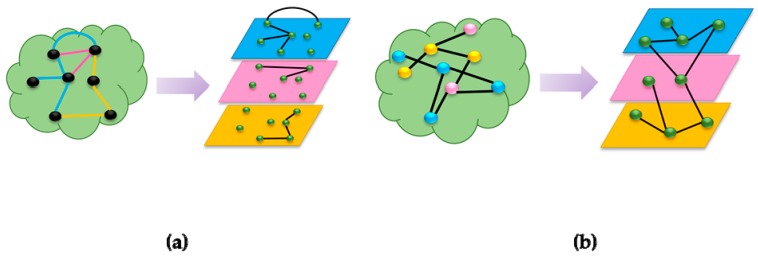
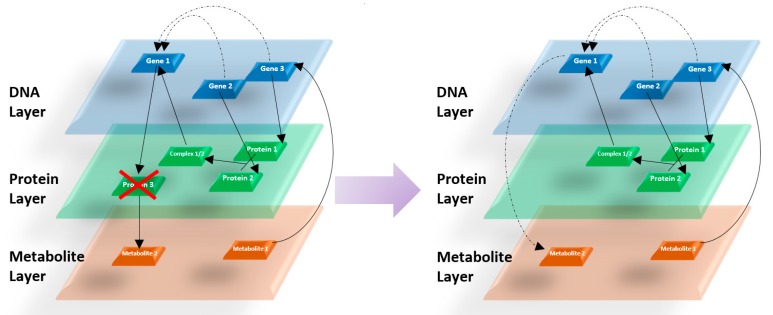
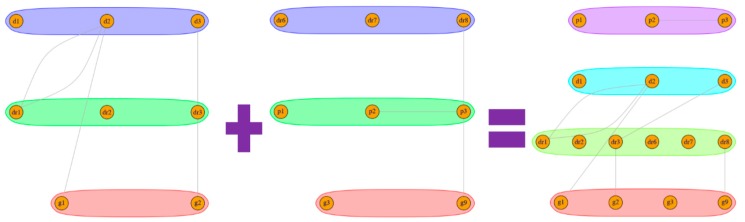
The modelling of complex biological networks such as pathways has been a necessity for scientists over the last decades. The study of these networks also imposes a need to investigate different aspects of nodes or edges within the networks, or other biomedical knowledge related to it. Our aim is to provide a generic modelling framework to integrate multiple pathway types and further knowledge sources influencing these networks. This framework is defined by a multi-layered model allowing automatic network transformations and documentation. By providing a tool that generates this model, we aim to facilitate the data integration, boost the reproducibility and increase the interoperability between different sources and databases in the field of pathways. We present R package that allows the user to create, modify and visualize graphs with multi-layers. The package is implemented with features to specifically handle multilayered graphs.

摘要

在过去几十年里,对诸如信号通路等复杂生物网络进行建模一直是科学家们的一项必要工作。对这些网络的研究也使得有必要研究网络中节点或边的不同方面,或与之相关的其他生物医学知识。我们的目标是提供一个通用的建模框架,以整合多种通路类型以及影响这些网络的进一步知识来源。这个框架由一个多层模型定义,允许自动进行网络转换和记录。通过提供一个生成此模型的工具,我们旨在促进数据整合,提高可重复性,并增强通路领域中不同来源和数据库之间的互操作性。我们展示了一个R包,它允许用户创建、修改和可视化多层图形。该包通过专门处理多层图形的功能来实现。

https://cdn.ncbi.nlm.nih.gov/pmc/blobs/2f3d/6267209/2add88e5fbef/genes-09-00519-g006.jpg
https://cdn.ncbi.nlm.nih.gov/pmc/blobs/2f3d/6267209/831eb6ae420c/genes-09-00519-g001.jpg
https://cdn.ncbi.nlm.nih.gov/pmc/blobs/2f3d/6267209/d4366759e2a3/genes-09-00519-g002.jpg
https://cdn.ncbi.nlm.nih.gov/pmc/blobs/2f3d/6267209/31eba8248447/genes-09-00519-g003.jpg
https://cdn.ncbi.nlm.nih.gov/pmc/blobs/2f3d/6267209/2412c48dd93e/genes-09-00519-g004.jpg
https://cdn.ncbi.nlm.nih.gov/pmc/blobs/2f3d/6267209/bc837bc51572/genes-09-00519-g005.jpg
https://cdn.ncbi.nlm.nih.gov/pmc/blobs/2f3d/6267209/2add88e5fbef/genes-09-00519-g006.jpg

相似文献

1
: An R Package to Create, Modify and Visualize Multilayered Graphs.一个用于创建、修改和可视化多层图的R包。
Genes (Basel). 2018 Oct 23;9(11):519. doi: 10.3390/genes9110519.
2
Crosslink: An R Package for Network Visualization of Grouped Nodes.Crosslink:一个用于对分组节点进行网络可视化的R包。
Front Genet. 2021 Jul 16;12:706854. doi: 10.3389/fgene.2021.706854. eCollection 2021.
3
Multipath: An R Package to Generate Integrated Reproducible Pathway Models.Multipath:一个用于生成可重现综合通路模型的R包。
Biology (Basel). 2020 Dec 21;9(12):483. doi: 10.3390/biology9120483.
4
SignaLink: Multilayered Regulatory Networks.信号链接:多层调控网络
Methods Mol Biol. 2018;1819:53-73. doi: 10.1007/978-1-4939-8618-7_3.
5
Linking experimental results, biological networks and sequence analysis methods using Ontologies and Generalised Data Structures.使用本体和通用数据结构连接实验结果、生物网络和序列分析方法。
In Silico Biol. 2005;5(1):33-44.
6
rBiopaxParser--an R package to parse, modify and visualize BioPAX data.rBiopaxParser——一个解析、修改和可视化 BioPAX 数据的 R 包。
Bioinformatics. 2013 Feb 15;29(4):520-2. doi: 10.1093/bioinformatics/bts710. Epub 2012 Dec 28.
7
Deep graphs-A general framework to represent and analyze heterogeneous complex systems across scales.深度图——一种跨尺度表示和分析异构复杂系统的通用框架。
Chaos. 2016 Jun;26(6):065303. doi: 10.1063/1.4952963.
8
Pathview: an R/Bioconductor package for pathway-based data integration and visualization.Pathview:一个基于 R/Bioconductor 的用于通路数据整合和可视化的软件包。
Bioinformatics. 2013 Jul 15;29(14):1830-1. doi: 10.1093/bioinformatics/btt285. Epub 2013 Jun 4.
9
Introduction to Focus Issue: Complex Dynamics in Networks, Multilayered Structures and Systems.焦点问题介绍:网络、多层结构和系统中的复杂动力学
Chaos. 2016 Jun;26(6):065101. doi: 10.1063/1.4953595.
10
cisPath: an R/Bioconductor package for cloud users for visualization and management of functional protein interaction networks.cisPath:一个供云用户使用的R/Bioconductor软件包,用于可视化和管理功能性蛋白质相互作用网络。
BMC Syst Biol. 2015;9 Suppl 1(Suppl 1):S1. doi: 10.1186/1752-0509-9-S1-S1. Epub 2015 Jan 21.

引用本文的文献

1
Mechanistic analysis of enhancer sequences in the estrogen receptor transcriptional program.雌激素受体转录程序中增强子序列的机制分析。
Commun Biol. 2024 Jun 11;7(1):719. doi: 10.1038/s42003-024-06400-5.
2
Transomics2cytoscape: an automated software for interpretable 2.5-dimensional visualization of trans-omic networks.转录组学2细胞图谱:一种用于转录组网络可解释性二维半可视化的自动化软件。
NPJ Syst Biol Appl. 2024 Feb 19;10(1):16. doi: 10.1038/s41540-024-00342-8.
3
Network-Based Approaches Reveal Potential Therapeutic Targets for Host-Directed Antileishmanial Therapy Driving Drug Repurposing.

本文引用的文献

1
The structure and dynamics of multilayer networks.多层网络的结构与动态特性
Phys Rep. 2014 Nov 1;544(1):1-122. doi: 10.1016/j.physrep.2014.07.001. Epub 2014 Jul 10.
2
ndexr-an R package to interface with the network data exchange.ndexr 是一个用于与网络数据交换接口的 R 包。
Bioinformatics. 2018 Feb 15;34(4):716-717. doi: 10.1093/bioinformatics/btx683.
3
Deep graphs-A general framework to represent and analyze heterogeneous complex systems across scales.深度图——一种跨尺度表示和分析异构复杂系统的通用框架。
基于网络的方法揭示了针对宿主定向抗利什曼病治疗的潜在治疗靶点,推动了药物再利用。
Microbiol Spectr. 2021 Oct 31;9(2):e0101821. doi: 10.1128/Spectrum.01018-21. Epub 2021 Oct 20.
4
Comparative Analyses of Gene Co-expression Networks: Implementations and Applications in the Study of Evolution.基因共表达网络的比较分析:在进化研究中的实现与应用
Front Genet. 2021 Aug 13;12:695399. doi: 10.3389/fgene.2021.695399. eCollection 2021.
5
Arena3Dweb: interactive 3D visualization of multilayered networks.Arena3Dweb:多层网络的交互式 3D 可视化。
Nucleic Acids Res. 2021 Jul 2;49(W1):W36-W45. doi: 10.1093/nar/gkab278.
6
Multipath: An R Package to Generate Integrated Reproducible Pathway Models.Multipath:一个用于生成可重现综合通路模型的R包。
Biology (Basel). 2020 Dec 21;9(12):483. doi: 10.3390/biology9120483.
Chaos. 2016 Jun;26(6):065303. doi: 10.1063/1.4952963.
4
CyREST: Turbocharging Cytoscape Access for External Tools via a RESTful API.CyREST:通过RESTful API为外部工具加速Cytoscape访问。
F1000Res. 2015 Aug 5;4:478. doi: 10.12688/f1000research.6767.1. eCollection 2015.
5
NDEx, the Network Data Exchange.NDEx,即网络数据交换。
Cell Syst. 2015 Oct 28;1(4):302-305. doi: 10.1016/j.cels.2015.10.001.
6
Methods for biological data integration: perspectives and challenges.生物数据整合方法:观点与挑战
J R Soc Interface. 2015 Nov 6;12(112). doi: 10.1098/rsif.2015.0571.
7
Visualizing genome and systems biology: technologies, tools, implementation techniques and trends, past, present and future.可视化基因组与系统生物学:技术、工具、实施方法及趋势,过去、现在与未来
Gigascience. 2015 Aug 25;4:38. doi: 10.1186/s13742-015-0077-2. eCollection 2015.
8
Arena3D: visualizing time-driven phenotypic differences in biological systems.Arena3D:可视化生物系统中时间驱动的表型差异。
BMC Bioinformatics. 2012 Mar 22;13:45. doi: 10.1186/1471-2105-13-45.
9
Cell Illustrator 4.0: a computational platform for systems biology.细胞绘图软件4.0:一个用于系统生物学的计算平台。
In Silico Biol. 2010;10(1):5-26. doi: 10.3233/ISB-2010-0415.
10
Arena3D: visualization of biological networks in 3D.Arena3D:生物网络的三维可视化
BMC Syst Biol. 2008 Nov 28;2:104. doi: 10.1186/1752-0509-2-104.