Medecins Sans Frontieres (OCG), P.O. Box 18, Eveni, Lot No. 331, Sheffield Road, Industrial Area, Mbabane, Swaziland.
Ministry of Health (National Reference Laboratory), Mbabane, Swaziland.
BMC Infect Dis. 2018 Nov 14;18(1):570. doi: 10.1186/s12879-018-3474-1.
Viral load (VL) testing is being scaled up in resource-limited settings. However, not all commercially available VL testing methods have been evaluated under field conditions. This study is one of a few to evaluate the Biocentric platform for VL quantification in routine practice in Sub-Saharan Africa.
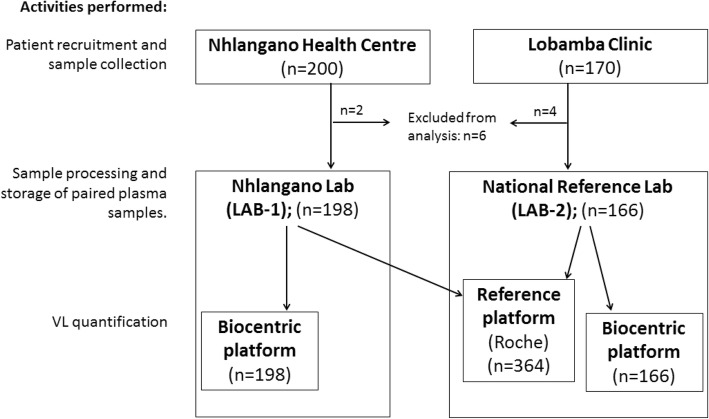
Venous blood specimens were obtained from patients eligible for VL testing at two health facilities in Swaziland from October 2016 to March 2017. Samples were centrifuged at two laboratories (LAB-1, LAB-2) to obtain paired plasma specimens for VL quantification with the national reference method and on the Biocentric platform. Agreement (correlation, Bland-Altman) and accuracy (sensitivity, specificity) indicators were calculated at the VL thresholds of 416 (2.62 log) and 1000 (3.0 log) copies/mL. Leftover samples from patients with discordant VL results were re-quantified and accuracy indicators recalculated. Logistic regression was used to compare laboratory performance.
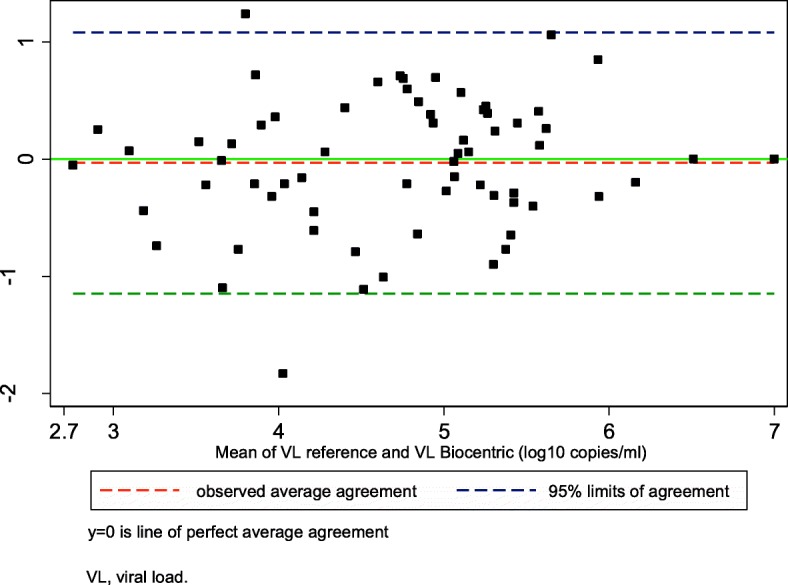
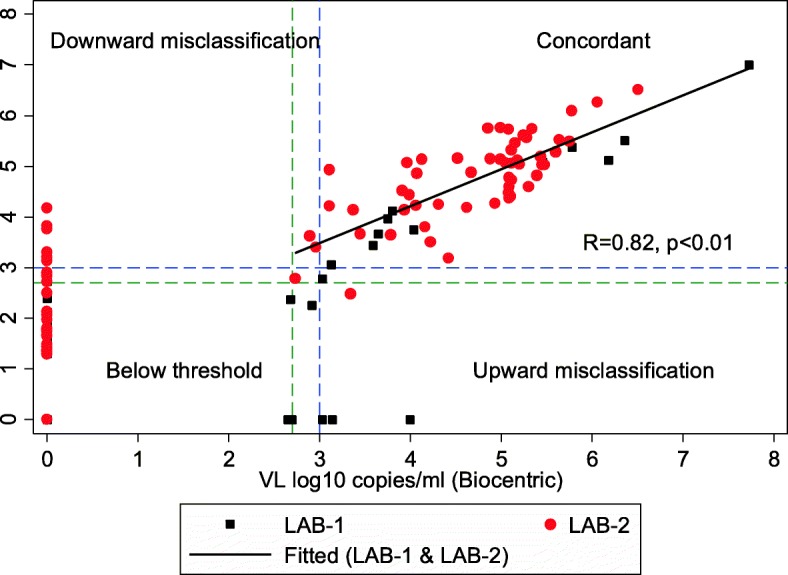
A total of 364 paired plasma samples (LAB-1: n = 198; LAB-2: n = 166) were successfully tested using both methods. The correlation was high (R = 0.82, p < 0.01), and the Bland-Altman analysis showed a minimal mean difference (- 0.03 log copies/mL; 95% CI: -1.15 to 1.08). At the clinical threshold level of 3.0 log copies/mL, the sensitivity was 88.6% (95% CI: 78.7 to 94.9) and the specificity was 98.3% (95% CI: 96.1 to 99.4). Sensitivity was higher in LAB-1 (100%; 95% CI: 71.5 to 100) than in LAB-2 (86.4%; 95% CI: 75.0 to 94.0). Most upward (n = 8, 2.2%) and downward (n = 11, 3.0%) misclassifications occurred at the 2.62 log threshold, with LAB-2 having a 16 (95% CI: 2.26 to 113.27; p = 0.006) times higher odds of downward misclassification. After retesting of discordant leftover samples (n = 17), overall sensitivity increased to 93.5% (95% CI: 85.5 to 97.9) and 97.1% (95% CI: 90.1 to 99.7) at the 2.62 and 3.0 thresholds, and specificity increased to 98.6% (95% CI: 96.5 to 99.6) and 99.0% (95% CI: 97.0 to 99.8) respectively.
The test characteristics of the Biocentric platform were overall comparable to the national reference method for VL quantification. One laboratory tended to misclassify VL results downwards, likely owing to unmet training needs and lack of previous hands-on practice.
病毒载量(VL)检测正在资源有限的环境中得到扩展。然而,并非所有市售的 VL 检测方法都已在现场条件下进行评估。本研究是为数不多的评估 Biocentric 平台在撒哈拉以南非洲常规实践中进行 VL 定量检测的研究之一。
2016 年 10 月至 2017 年 3 月,从斯威士兰的两个卫生机构中符合 VL 检测条件的患者中采集静脉血标本。将样本在两个实验室(实验室 1、实验室 2)中离心,分别采用国家参考方法和 Biocentric 平台对配对血浆样本进行 VL 定量检测。在 416(2.62 log)和 1000(3.0 log)拷贝/ml 的 VL 阈值下计算了一致性(相关性、Bland-Altman)和准确性(敏感性、特异性)指标。对具有不一致 VL 结果的患者的剩余样本进行重新定量,并重新计算准确性指标。使用逻辑回归比较实验室性能。
共成功检测了 364 对配对血浆样本(实验室 1:n=198;实验室 2:n=166)。两种方法的相关性很高(R=0.82,p<0.01),Bland-Altman 分析显示平均差异最小(-0.03 log 拷贝/ml;95%CI:-1.15 至 1.08)。在临床 3.0 log 拷贝/ml 的阈值水平,敏感性为 88.6%(95%CI:78.7 至 94.9),特异性为 98.3%(95%CI:96.1 至 99.4)。实验室 1 的敏感性(100%;95%CI:71.5 至 100)高于实验室 2(86.4%;95%CI:75.0 至 94.0)。大多数向上(n=8,2.2%)和向下(n=11,3.0%)错误分类发生在 2.62 log 阈值,实验室 2 的向下错误分类可能性高 16 倍(95%CI:2.26 至 113.27;p=0.006)。对不一致的剩余样本(n=17)进行重新检测后,总敏感性提高到 93.5%(95%CI:85.5 至 97.9)和 97.1%(95%CI:90.1 至 99.7),2.62 和 3.0 阈值,特异性提高到 98.6%(95%CI:96.5 至 99.6)和 99.0%(95%CI:97.0 至 99.8)。
Biocentric 平台的检测特征总体上与国家 VL 定量参考方法相当。一个实验室倾向于将 VL 结果向下错误分类,可能是由于培训需求未得到满足和缺乏实践经验。