Nuffield Department of Women's & Reproductive Health, University of Oxford, John Radcliffe Hospital, Headington, Oxford, OX3 9DU, UK.
Centre for Statistics in Medicine, Botnar Research Centre, Nuffield Department of Orthopaedics, Rheumatology and Musculoskeletal Sciences, University of Oxford, Windmill Road, Oxford, OX3 7LD, UK.
Stat Med. 2019 Aug 30;38(19):3507-3526. doi: 10.1002/sim.8018. Epub 2018 Nov 28.
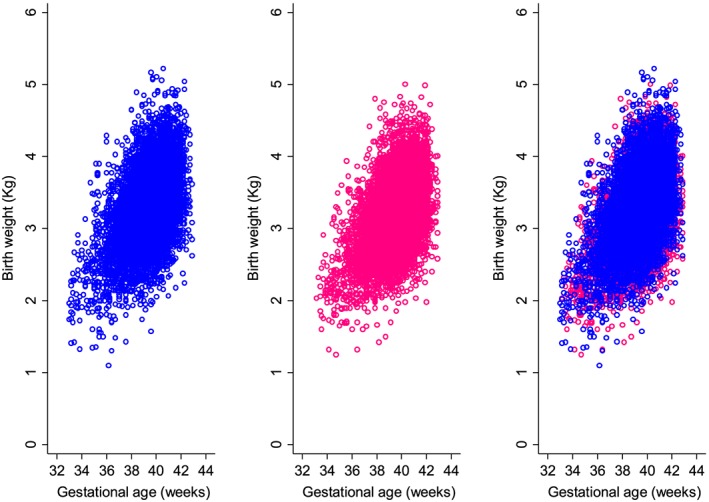
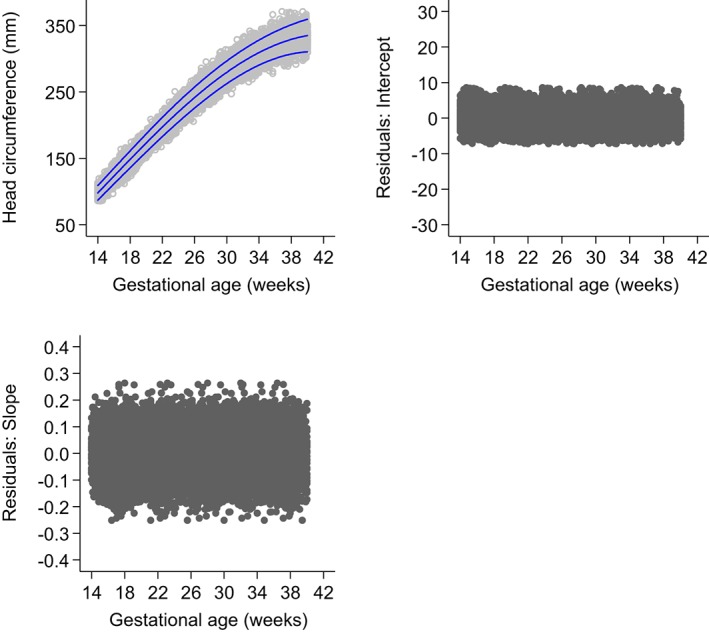
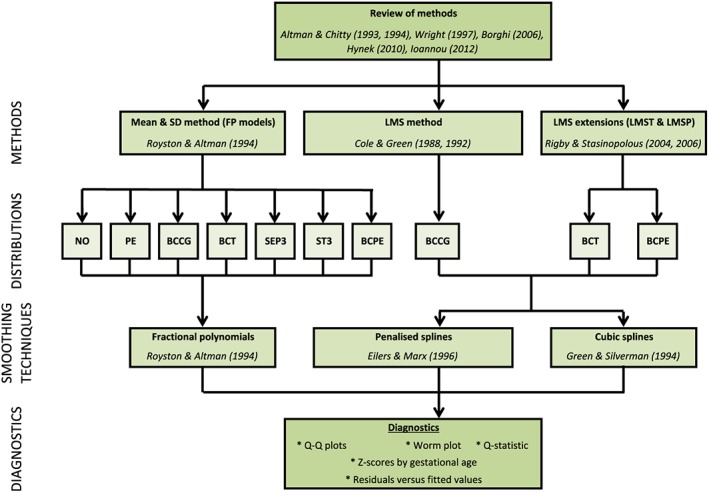
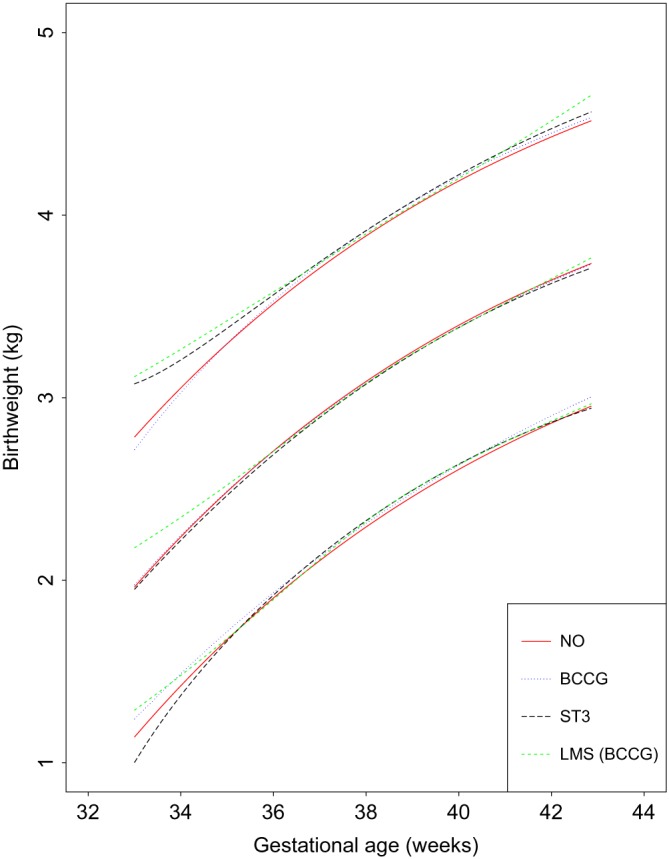
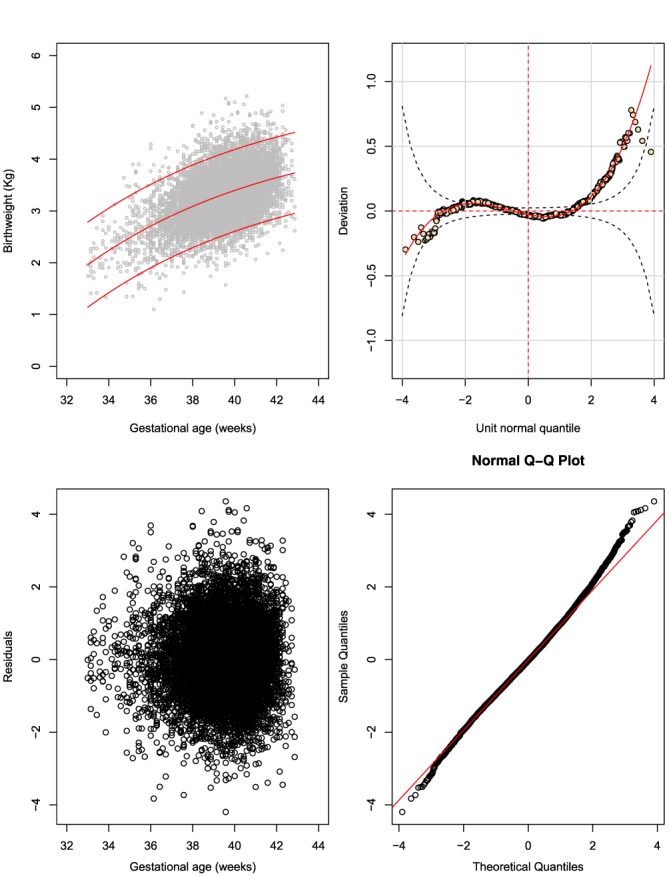
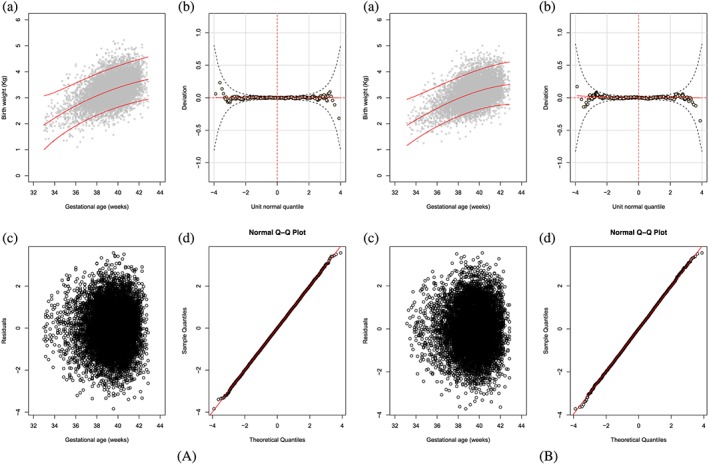
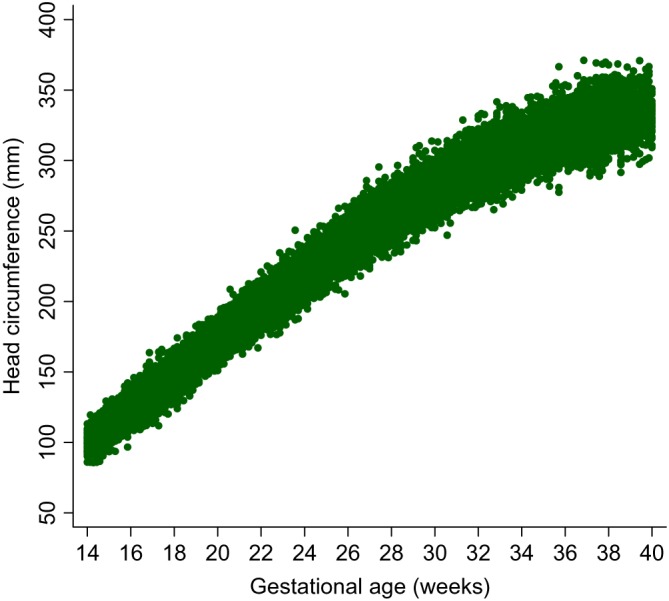
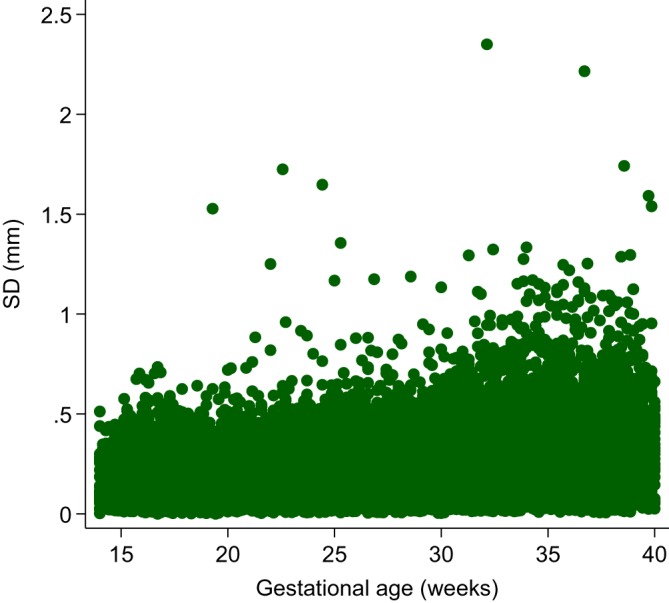
Most studies aiming to construct reference or standard charts use a cross-sectional design, collecting one measurement per participant. Reference or standard charts can also be constructed using a longitudinal design, collecting multiple measurements per participant. The choice of appropriate statistical methodology is important as inaccurate centiles resulting from inferior methods can lead to incorrect judgements about fetal or newborn size, resulting in suboptimal clinical care. Reference or standard centiles should ideally provide the best fit to the data, change smoothly with age (eg, gestational age), use as simple a statistical model as possible without compromising model fit, and allow the computation of Z-scores from centiles to simplify assessment of individuals and enable comparison with different populations. Significance testing and goodness-of-fit statistics are usually used to discriminate between models. However, these methods tend not to be useful when examining large data sets as very small differences are statistically significant even if the models are indistinguishable on actual centile plots. Choosing the best model from amongst many is therefore not trivial. Model choice should not be based on statistical considerations (or tests) alone as sometimes the best model may not necessarily offer the best fit to the raw data across gestational age. In this paper, we describe the most commonly applied methodologies available for the construction of age-specific reference or standard centiles for cross-sectional and longitudinal data: Fractional polynomial regression, LMS, LMST, LMSP, and multilevel regression methods. For illustration, we used data from the INTERGROWTH-21 Project, ie, newborn weight (cross-sectional) and fetal head circumference (longitudinal) data as examples.
大多数旨在构建参考或标准图表的研究都采用横断面设计,每个参与者收集一个测量值。参考或标准图表也可以使用纵向设计构建,每个参与者收集多个测量值。选择适当的统计方法学非常重要,因为不准确的百分位数会导致不准确的胎儿或新生儿大小判断,从而导致不理想的临床护理。参考或标准百分位数应该理想地与数据拟合得最好,随着年龄(例如,胎龄)平滑变化,使用尽可能简单的统计模型,而不会影响模型拟合,并且允许从百分位数计算 Z 分数,以简化个体评估并实现与不同人群的比较。显著性检验和拟合优度统计通常用于区分模型。然而,当检查大型数据集时,这些方法往往不太有用,因为即使模型在实际百分位数图上无法区分,很小的差异在统计学上也是显著的。因此,从众多模型中选择最佳模型并非易事。选择最佳模型不应仅基于统计考虑(或检验),因为有时最佳模型不一定在整个胎龄范围内提供对原始数据的最佳拟合。在本文中,我们描述了用于构建横断面和纵向数据的特定年龄参考或标准百分位数的最常用方法:分数多项式回归、LMS、LMST、LMSP 和多层回归方法。为了说明,我们使用了 INTERGROWTH-21 项目的数据,即新生儿体重(横断面)和胎儿头围(纵向)数据作为示例。