Center for Machine Vision and Signal Analysis, Faculty of Information Technology and Electrical Engineering, University of Oulu, PO Box 4500, 90014, Oulu, Finland.
Department of Diagnostic Radiology, Oulu University Hospital, Oulu, Finland.
Ann Biomed Eng. 2019 May;47(5):1181-1190. doi: 10.1007/s10439-019-02227-y. Epub 2019 Feb 14.
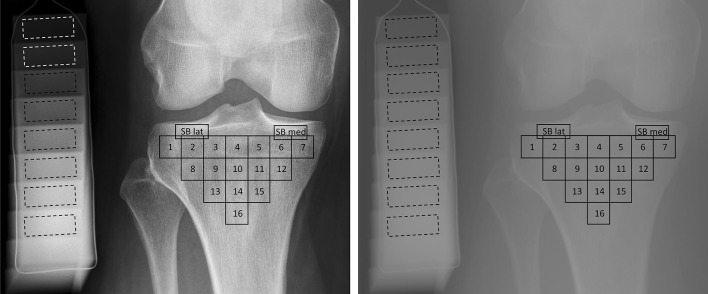
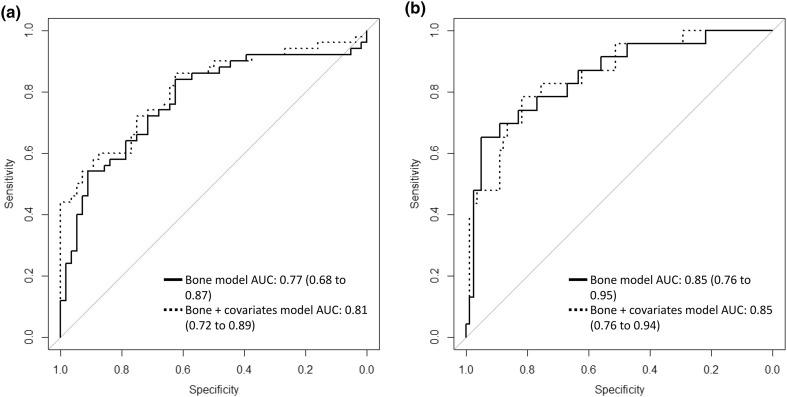
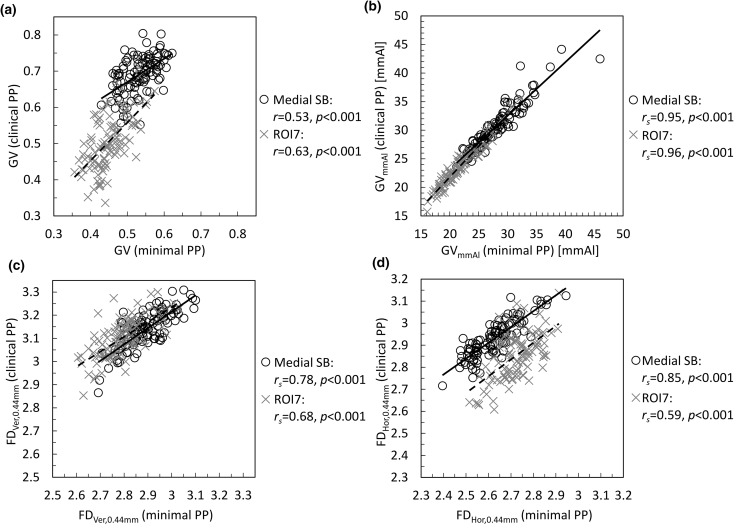
Plain radiography is the most common modality to assess the stage of osteoarthritis. Our aims were to assess the relationship of radiography-based bone density and texture between radiographs with minimal and clinical post-processing, and to compare the differences in bone characteristics between controls and subjects with knee osteoarthritis or medial tibial bone marrow lesions (BMLs). Tibial bone density and texture was evaluated from radiographs with both minimal and clinical post-processing in 109 subjects with and without osteoarthritis. Bone texture was evaluated using fractal signature analysis. Significant correlations (p < 0.001) were found in all regions (between 0.94 and 0.97) for calibrated bone density between radiographs with minimal and clinical post-processing. Correlations varied between 0.51 and 0.97 (p < 0.001) for FD texture parameter and between - 0.10 and 0.97 for FD. Bone density and texture were different (p < 0.05) between controls and subjects with osteoarthritis or BMLs mainly in medial tibial regions. When classifying healthy and osteoarthritic subjects using a machine learning-based elastic net model with bone characteristics, area under the receiver operating characteristics (ROCAUC) curve was 0.77. For classifying controls and subjects with BMLs, ROCAUC was 0.85. In conclusion, differences in bone density and texture can be assessed from knee radiographs when using minimal post-processing.
X 光摄影是评估骨关节炎分期最常用的方法。我们的目的是评估最小和临床后处理的 X 光片之间基于影像学的骨密度和纹理的关系,并比较膝关节骨关节炎或胫骨内侧骨髓病变(BML)患者与对照组之间的骨特征差异。在 109 名有或没有骨关节炎的患者中,使用最小和临床后处理的 X 光片评估胫骨骨密度和纹理。使用分形签名分析评估骨纹理。在最小和临床后处理的 X 光片之间,校准骨密度在所有区域(0.94 到 0.97 之间)均存在显著相关性(p < 0.001)。FD 纹理参数的相关性在 0.51 到 0.97 之间(p < 0.001),FD 的相关性在-0.10 到 0.97 之间。骨密度和纹理在对照组和骨关节炎或 BML 患者之间存在差异(p < 0.05),主要在胫骨内侧区域。当使用基于机器学习的弹性网模型和骨特征对健康和骨关节炎患者进行分类时,接收器操作特征(ROC)曲线下面积为 0.77。当对对照组和 BML 患者进行分类时,ROC 曲线下面积为 0.85。总之,当使用最小后处理时,可以从膝关节 X 光片评估骨密度和纹理的差异。