• 文献检索
  • 文档翻译
  • 深度研究
  • 学术资讯
  • Suppr Zotero 插件Zotero 插件
  • 邀请有礼
  • 套餐&价格
  • 历史记录
应用&插件
Suppr Zotero 插件Zotero 插件浏览器插件Mac 客户端Windows 客户端微信小程序
定价
高级版会员购买积分包购买API积分包
服务
文献检索文档翻译深度研究API 文档MCP 服务
关于我们
关于 Suppr公司介绍联系我们用户协议隐私条款
关注我们

Suppr 超能文献

核心技术专利:CN118964589B侵权必究
粤ICP备2023148730 号-1Suppr @ 2026

文献检索

告别复杂PubMed语法,用中文像聊天一样搜索,搜遍4000万医学文献。AI智能推荐,让科研检索更轻松。

立即免费搜索

文件翻译

保留排版,准确专业,支持PDF/Word/PPT等文件格式,支持 12+语言互译。

免费翻译文档

深度研究

AI帮你快速写综述,25分钟生成高质量综述,智能提取关键信息,辅助科研写作。

立即免费体验

基于超前沿的中国长江经济带碳排放效率的跨区域比较研究。

Cross-Regional Comparative Study on Carbon Emission Efficiency of China's Yangtze River Economic Belt Based on the Meta-Frontier.

机构信息

School of Business Administration, Hohai University, Changzhou 213022, China.

Business School, Hohai University, Nanjing 211100, China.

出版信息

Int J Environ Res Public Health. 2019 Feb 20;16(4):619. doi: 10.3390/ijerph16040619.

DOI:10.3390/ijerph16040619
PMID:30791571
原文链接:https://pmc.ncbi.nlm.nih.gov/articles/PMC6406763/
Abstract

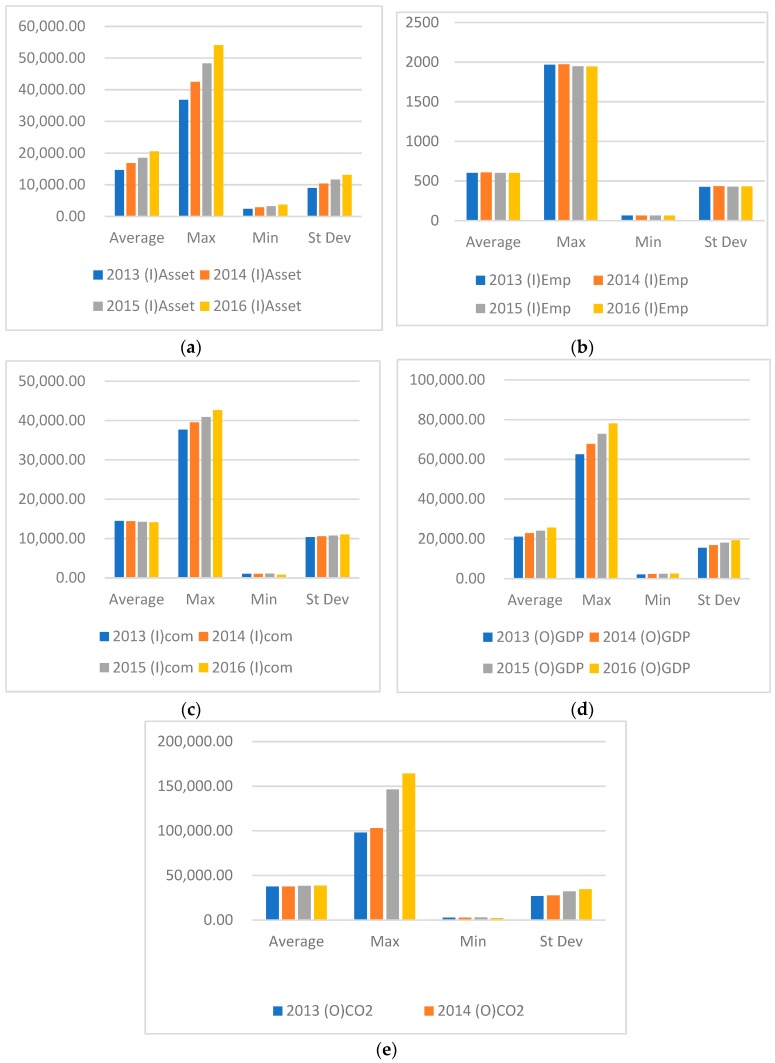
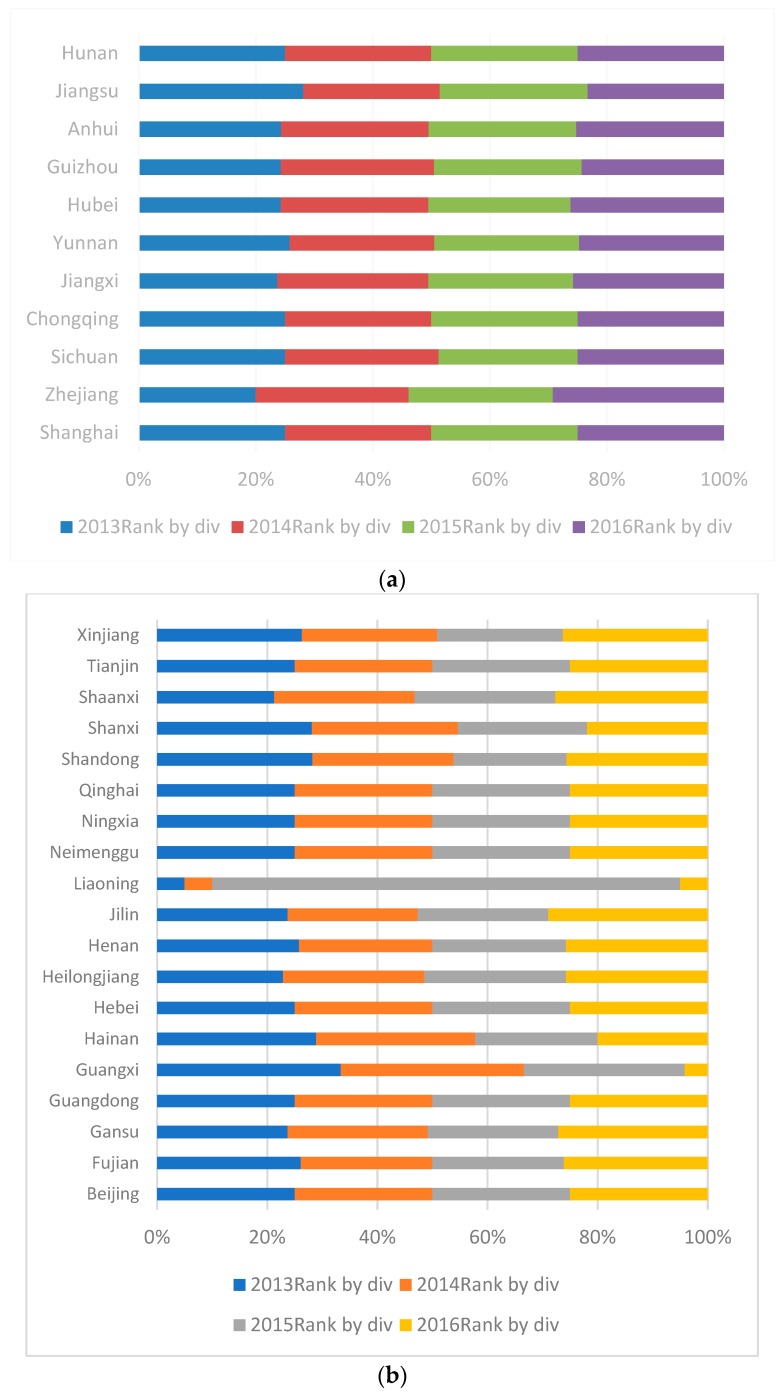
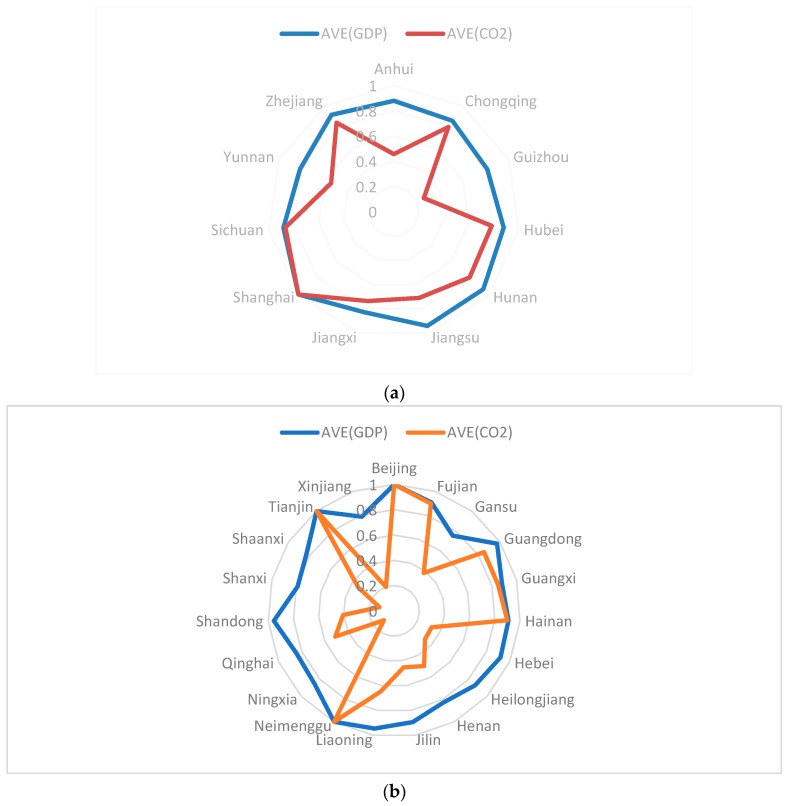
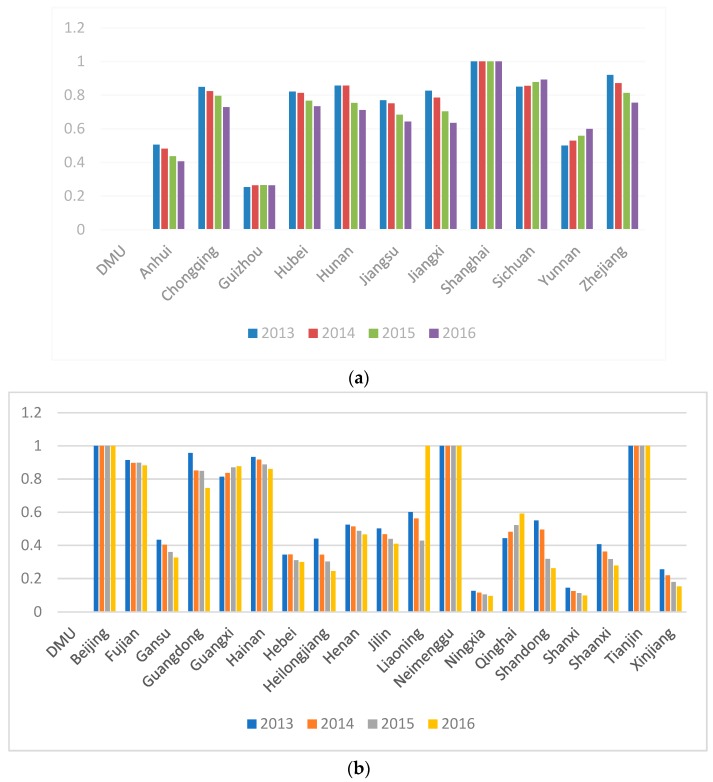
The Yangtze River Economic Belt (YREB) is one of the most important areas for the economic growth of China, but rapid development has caused tremendous damage to the energy and ecological environments of the region. Very few studies have compared the carbon emissions of YREB with that of non-YREB and furthermore, have not considered regional differences and radial or non-radial characteristics in their analysis. This paper thus selects the energy consumption data of 19 provinces and cities in YREB and 19 provinces and cities in non-YREB from 2013 to 2016, constructs the modified meta-frontier Epsilou-based measure (EBM) data envelopment analysis (DEA) model and adds an undesirable factor, energy consumption, and CO₂ emission efficiency of each province and city of the two regions. The results are as follows. (1) China's provinces and cities have different energy efficiency scores in energy consumption, economic growth, and CO₂ emissions. The regional ranks and technology gaps of five provinces and cities in non-YREB and of four provinces and cities in YREB exhibit a decline. Overall, the ranks and technology gaps of the provinces and cities in YREB are significantly lower than those in non-YREB, meaning that there is greater room for efficiency improvement in the latter region. (2) The gross domestic product (GDP) and CO₂ efficiency values of non-YREB provinces present great differences, especially the CO₂ efficiency value that ranges from 0.2 to 1, while their values in YREB are more balanced with little difference between provinces and cities. Thus, YREB is more coordinated in terms of energy savings and air pollutant reduction. (3) Some cities with good economic development such as Beijing, Shanghai, and Tianjin have regional and technology gap values of one, indicating that they not only target economic growth but also address energy savings and air pollutant reduction. The regional rank and technology gap values of some underdeveloped provinces such as Neimenggu, Ningxia, and Qinghai are also one. Finally, this research proposes countermeasures and recommendations to both areas.

摘要

长江经济带是中国经济增长的重要区域之一,但快速发展给该地区的能源和生态环境带来了巨大破坏。很少有研究将长江经济带的碳排放与非长江经济带的碳排放进行比较,而且在分析中没有考虑到区域差异和径向或非径向特征。因此,本文选择了 2013 年至 2016 年长江经济带 19 个省市和非长江经济带 19 个省市的能源消费数据,构建了修正的基于超效率 Epsilou 的测度(EBM)数据包络分析(DEA)模型,并加入了一个非期望产出因素,即各省市的能源消费和 CO₂排放效率。结果如下:(1)中国各省市在能源消费、经济增长和 CO₂排放方面的能源效率得分存在差异。非长江经济带的五个省市和长江经济带的四个省市的区域排名和技术差距呈下降趋势。总体而言,长江经济带省市的排名和技术差距明显低于非长江经济带省市,表明后者在提高效率方面有更大的空间。(2)非长江经济带省市的国内生产总值(GDP)和 CO₂效率值差异较大,特别是 CO₂效率值在 0.2 到 1 之间,而长江经济带省市的 GDP 和 CO₂效率值则更为均衡,省市之间的差异较小。因此,长江经济带在节能减排方面更加协调。(3)一些经济发展良好的城市,如北京、上海和天津,其区域和技术差距值为 1,这表明它们不仅以经济增长为目标,还注重节能减排。一些欠发达省份,如内蒙古、宁夏和青海的区域排名和技术差距值也为 1。最后,本文为两个地区提出了对策和建议。

https://cdn.ncbi.nlm.nih.gov/pmc/blobs/1ee3/6406763/a3c11c4afe2c/ijerph-16-00619-g004.jpg
https://cdn.ncbi.nlm.nih.gov/pmc/blobs/1ee3/6406763/20e2d2317ebd/ijerph-16-00619-g001.jpg
https://cdn.ncbi.nlm.nih.gov/pmc/blobs/1ee3/6406763/9f7a1b49c072/ijerph-16-00619-g002.jpg
https://cdn.ncbi.nlm.nih.gov/pmc/blobs/1ee3/6406763/ce629f826a83/ijerph-16-00619-g003.jpg
https://cdn.ncbi.nlm.nih.gov/pmc/blobs/1ee3/6406763/a3c11c4afe2c/ijerph-16-00619-g004.jpg

相似文献

1
Cross-Regional Comparative Study on Carbon Emission Efficiency of China's Yangtze River Economic Belt Based on the Meta-Frontier.基于超前沿的中国长江经济带碳排放效率的跨区域比较研究。
Int J Environ Res Public Health. 2019 Feb 20;16(4):619. doi: 10.3390/ijerph16040619.
2
Spatial and temporal evolution of urban economic development efficiency in China's Yangtze River economic belt from the perspective of sustainable development.从可持续发展的角度看中国长江经济带城市经济发展效率的时空演变。
PLoS One. 2022 Sep 12;17(9):e0273559. doi: 10.1371/journal.pone.0273559. eCollection 2022.
3
Socio-economic drivers of rising CO emissions at the sectoral and sub-regional levels in the Yangtze River Economic Belt.长江经济带部门和次区域层面 CO2 排放上升的社会经济驱动因素。
J Environ Manage. 2021 Jul 15;290:112617. doi: 10.1016/j.jenvman.2021.112617. Epub 2021 Apr 19.
4
Yangtze River Economic Belt environmental remediation efficiency based on an input-output optimization analysis.基于投入产出优化分析的长江经济带环境整治效率。
Environ Sci Pollut Res Int. 2021 Apr;28(13):16734-16743. doi: 10.1007/s11356-020-11989-1. Epub 2021 Jan 4.
5
A Comprehensive Evaluation of Carbon Emission Reduction Capability in the Yangtze River Economic Belt.长江经济带减碳能力综合评价。
Int J Environ Res Public Health. 2020 Jan 15;17(2):545. doi: 10.3390/ijerph17020545.
6
Green Total-Factor Energy Efficiency of Construction Industry and Its Driving Factors: Spatial-Temporal Heterogeneity of Yangtze River Economic Belt in China.中国长江经济带建筑业全要素能源效率及其驱动因素的时空分异。
Int J Environ Res Public Health. 2022 Aug 12;19(16):9972. doi: 10.3390/ijerph19169972.
7
New Energy Development and Pollution Emissions in China.中国新能源开发与污染排放。
Int J Environ Res Public Health. 2019 May 18;16(10):1764. doi: 10.3390/ijerph16101764.
8
Spatio-temporal heterogeneity of air pollution and its key influencing factors in the Yellow River Economic Belt of China from 2014 to 2019.2014 年至 2019 年中国黄河经济带空气污染的时空异质性及其关键影响因素。
J Environ Manage. 2021 Oct 15;296:113172. doi: 10.1016/j.jenvman.2021.113172. Epub 2021 Jul 2.
9
Eco-efficiency evaluation model: a case study of the Yangtze River Economic Belt.生态效率评价模型:以长江经济带为例。
Environ Monit Assess. 2021 Jul 2;193(7):457. doi: 10.1007/s10661-021-09228-2.
10
Carbon emissions in the transportation sector of Yangtze River Economic Belt: decoupling drivers and inequality.长江经济带交通运输部门的碳排放:脱钩驱动因素和不平等。
Environ Sci Pollut Res Int. 2020 Jun;27(17):21098-21108. doi: 10.1007/s11356-020-08479-9. Epub 2020 Apr 7.

引用本文的文献

1
Horizontal CO Compensation in the Yangtze River Delta Based on CO Footprints and CO Emissions Efficiency.基于 CO 足迹和 CO 排放效率的长三角地区水平 CO 补偿。
Int J Environ Res Public Health. 2023 Jan 12;20(2):1369. doi: 10.3390/ijerph20021369.
2
The Impact of the Media and Environmental Pollution on the Economy and Health Using a Modified Meta 2-Stage EBM Malmquist Model.利用修正后的 Meta 2 阶段 EBM Malmquist 模型研究媒体和环境污染对经济与健康的影响。
Inquiry. 2020 Jan-Dec;57:46958020921070. doi: 10.1177/0046958020921070.
3
Energy and Environment Performance of Resource-Based Cities in China: A Non-Parametric Approach for Estimating Hyperbolic Distance Function.
基于资源型城市的中国能源与环境绩效:双曲线距离函数的一种非参数估计方法
Int J Environ Res Public Health. 2020 Jul 3;17(13):4795. doi: 10.3390/ijerph17134795.
4
Impacts of Precipitation and Temperature on Changes in the Terrestrial Ecosystem Pattern in the Yangtze River Economic Belt, China.降水和温度对中国长江经济带陆地生态系统格局变化的影响。
Int J Environ Res Public Health. 2019 Dec 3;16(23):4872. doi: 10.3390/ijerph16234872.