• 文献检索
  • 文档翻译
  • 深度研究
  • 学术资讯
  • Suppr Zotero 插件Zotero 插件
  • 邀请有礼
  • 套餐&价格
  • 历史记录
应用&插件
Suppr Zotero 插件Zotero 插件浏览器插件Mac 客户端Windows 客户端微信小程序
定价
高级版会员购买积分包购买API积分包
服务
文献检索文档翻译深度研究API 文档MCP 服务
关于我们
关于 Suppr公司介绍联系我们用户协议隐私条款
关注我们

Suppr 超能文献

核心技术专利:CN118964589B侵权必究
粤ICP备2023148730 号-1Suppr @ 2026

文献检索

告别复杂PubMed语法,用中文像聊天一样搜索,搜遍4000万医学文献。AI智能推荐,让科研检索更轻松。

立即免费搜索

文件翻译

保留排版,准确专业,支持PDF/Word/PPT等文件格式,支持 12+语言互译。

免费翻译文档

深度研究

AI帮你快速写综述,25分钟生成高质量综述,智能提取关键信息,辅助科研写作。

立即免费体验

基因组与癌症数据的可视化分析:一项系统综述

Visual Analytics of Genomic and Cancer Data: A Systematic Review.

作者信息

Qu Zhonglin, Lau Chng Wei, Nguyen Quang Vinh, Zhou Yi, Catchpoole Daniel R

机构信息

School of Computing, Engineering and Mathematics, Western Sydney University, Penrith, NSW, Australia.

The MARCS Institute, Western Sydney University, Penrith, NSW, Australia.

出版信息

Cancer Inform. 2019 Mar 13;18:1176935119835546. doi: 10.1177/1176935119835546. eCollection 2019.

DOI:10.1177/1176935119835546
PMID:30890859
原文链接:https://pmc.ncbi.nlm.nih.gov/articles/PMC6416684/
Abstract

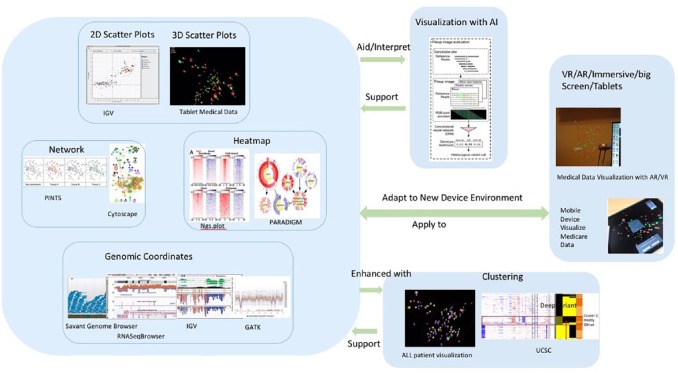
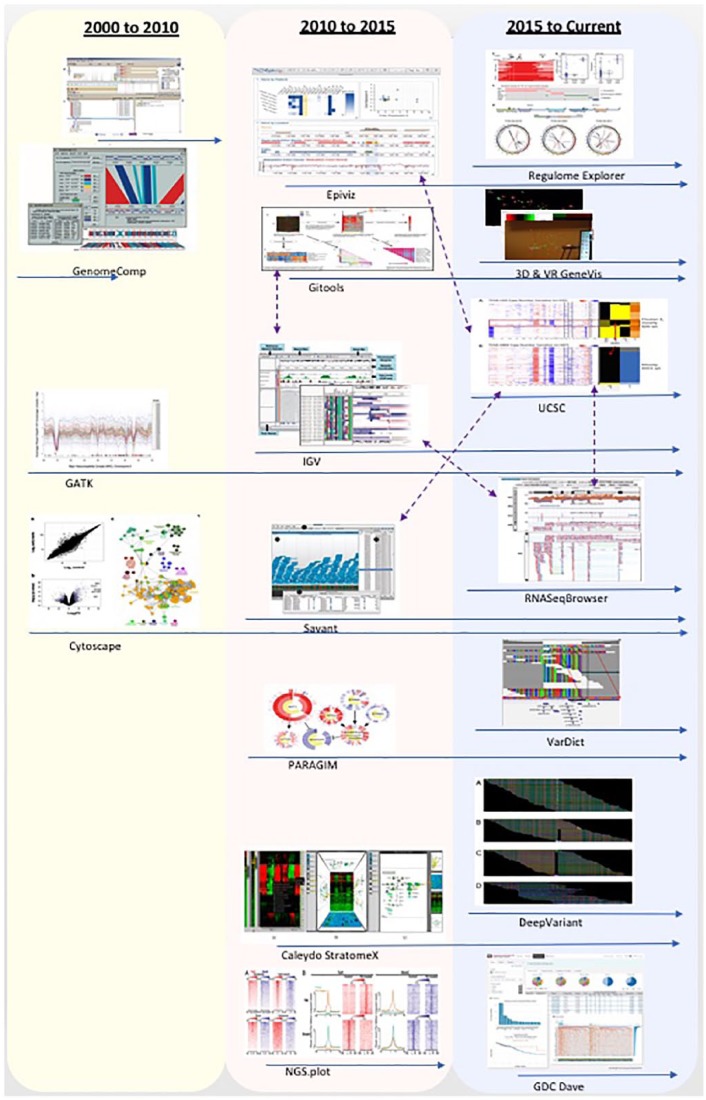
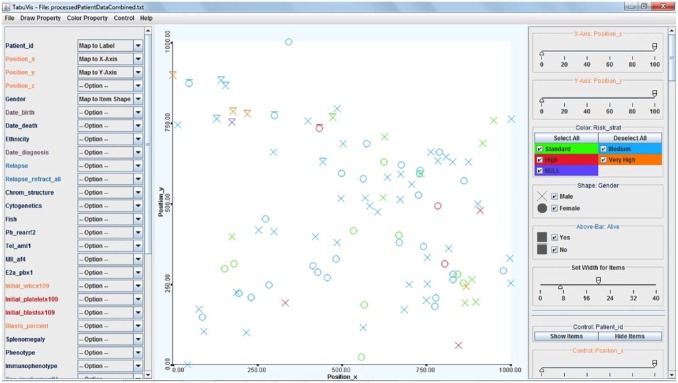
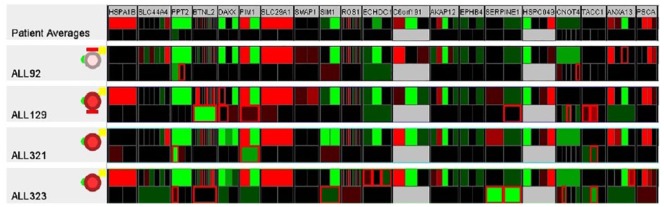
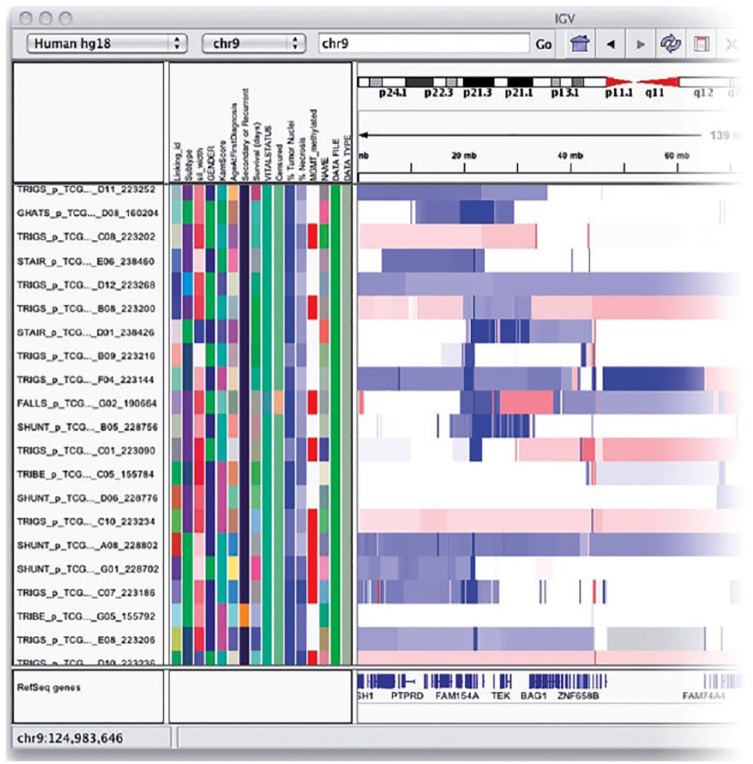
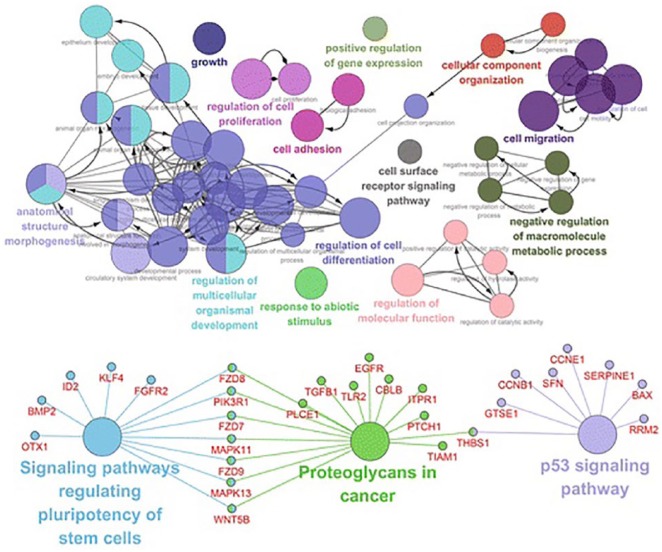
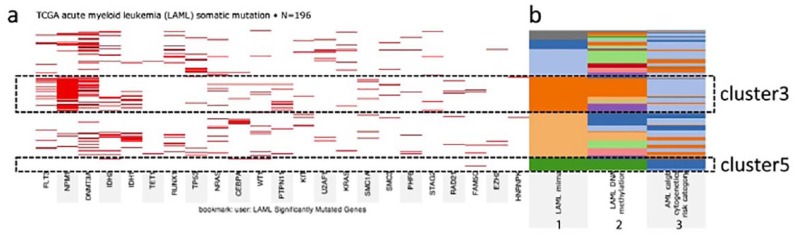
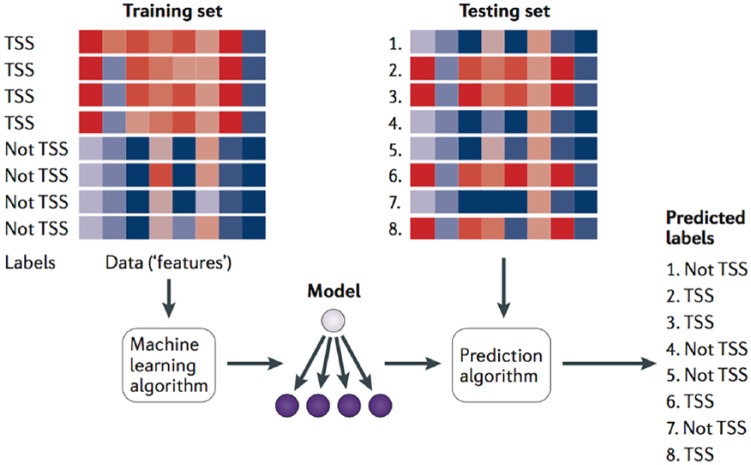
Visual analytics and visualisation can leverage the human perceptual system to interpret and uncover hidden patterns in big data. The advent of next-generation sequencing technologies has allowed the rapid production of massive amounts of genomic data and created a corresponding need for new tools and methods for visualising and interpreting these data. Visualising genomic data requires not only simply plotting of data but should also offer a decision or a choice about what the message should be conveyed in the particular plot; which methodologies should be used to represent the results must provide an easy, clear, and accurate way to the clinicians, experts, or researchers to interact with the data. Genomic data visual analytics is rapidly evolving in parallel with advances in high-throughput technologies such as artificial intelligence (AI) and virtual reality (VR). Personalised medicine requires new genomic visualisation tools, which can efficiently extract knowledge from the genomic data and speed up expert decisions about the best treatment of individual patient's needs. However, meaningful visual analytics of such large genomic data remains a serious challenge. This article provides a comprehensive systematic review and discussion on the tools, methods, and trends for visual analytics of cancer-related genomic data. We reviewed methods for genomic data visualisation including traditional approaches such as scatter plots, heatmaps, coordinates, and networks, as well as emerging technologies using AI and VR. We also demonstrate the development of genomic data visualisation tools over time and analyse the evolution of visualising genomic data.

摘要

可视化分析与可视化能够利用人类感知系统来解读和揭示大数据中隐藏的模式。新一代测序技术的出现使得海量基因组数据得以快速产生,相应地也催生了对可视化和解读这些数据的新工具及方法的需求。对基因组数据进行可视化不仅需要简单地绘制数据,还应就特定图表中应传达何种信息提供决策或选择;必须以简单、清晰且准确的方式向临床医生、专家或研究人员提供用于表示结果应采用哪些方法,以便他们与数据进行交互。随着人工智能(AI)和虚拟现实(VR)等高通量技术的进步,基因组数据可视化分析也在迅速发展。个性化医疗需要新的基因组可视化工具,这些工具能够从基因组数据中高效提取知识,并加快专家针对个体患者需求做出最佳治疗决策的速度。然而,对如此庞大的基因组数据进行有意义的可视化分析仍然是一项严峻的挑战。本文对癌症相关基因组数据的可视化分析工具、方法及趋势进行了全面系统的综述与讨论。我们回顾了基因组数据可视化方法,包括散点图、热图、坐标和网络等传统方法,以及使用人工智能和虚拟现实的新兴技术。我们还展示了基因组数据可视化工具随时间的发展,并分析了基因组数据可视化的演变过程。

https://cdn.ncbi.nlm.nih.gov/pmc/blobs/63c1/6416684/bdd03bc59335/10.1177_1176935119835546-fig9.jpg
https://cdn.ncbi.nlm.nih.gov/pmc/blobs/63c1/6416684/41922dfb2e58/10.1177_1176935119835546-fig1.jpg
https://cdn.ncbi.nlm.nih.gov/pmc/blobs/63c1/6416684/825da15563b3/10.1177_1176935119835546-fig2.jpg
https://cdn.ncbi.nlm.nih.gov/pmc/blobs/63c1/6416684/a1dfa3c12655/10.1177_1176935119835546-fig3.jpg
https://cdn.ncbi.nlm.nih.gov/pmc/blobs/63c1/6416684/4677b8c82716/10.1177_1176935119835546-fig4.jpg
https://cdn.ncbi.nlm.nih.gov/pmc/blobs/63c1/6416684/b46b13cf1337/10.1177_1176935119835546-fig5.jpg
https://cdn.ncbi.nlm.nih.gov/pmc/blobs/63c1/6416684/b67885ee5d52/10.1177_1176935119835546-fig6.jpg
https://cdn.ncbi.nlm.nih.gov/pmc/blobs/63c1/6416684/5898decc35a4/10.1177_1176935119835546-fig7.jpg
https://cdn.ncbi.nlm.nih.gov/pmc/blobs/63c1/6416684/56ac3e9fef92/10.1177_1176935119835546-fig8.jpg
https://cdn.ncbi.nlm.nih.gov/pmc/blobs/63c1/6416684/bdd03bc59335/10.1177_1176935119835546-fig9.jpg

相似文献

1
Visual Analytics of Genomic and Cancer Data: A Systematic Review.基因组与癌症数据的可视化分析:一项系统综述
Cancer Inform. 2019 Mar 13;18:1176935119835546. doi: 10.1177/1176935119835546. eCollection 2019.
2
Virtual reality for the observation of oncology models (VROOM): immersive analytics for oncology patient cohorts.虚拟现实观察肿瘤模型(VROOM):肿瘤患者队列的沉浸式分析。
Sci Rep. 2022 Jul 5;12(1):11337. doi: 10.1038/s41598-022-15548-1.
3
Understanding cancer patient cohorts in virtual reality environment for better clinical decisions: a usability study.在虚拟现实环境中理解癌症患者队列,以做出更好的临床决策:一项可用性研究。
BMC Med Inform Decis Mak. 2023 Dec 20;23(1):295. doi: 10.1186/s12911-023-02392-0.
4
Immersive Analytics: Theory and Research Agenda.沉浸式分析:理论与研究议程
Front Robot AI. 2019 Sep 10;6:82. doi: 10.3389/frobt.2019.00082. eCollection 2019.
5
Experts' perceptions on the use of visual analytics for complex mental healthcare planning: an exploratory study.专家对视觉分析在复杂精神卫生保健规划中应用的看法:一项探索性研究。
BMC Med Res Methodol. 2020 May 7;20(1):110. doi: 10.1186/s12874-020-00986-0.
6
From Virtual Reality to Immersive Analytics in Bioinformatics.从虚拟现实到生物信息学中的沉浸式分析
J Integr Bioinform. 2018 Jul 9;15(2):20180043. doi: 10.1515/jib-2018-0043.
7
Artificial intelligence approaches and mechanisms for big data analytics: a systematic study.用于大数据分析的人工智能方法与机制:一项系统研究。
PeerJ Comput Sci. 2021 Apr 14;7:e488. doi: 10.7717/peerj-cs.488. eCollection 2021.
8
Interactive Molecular Graphics for Augmented Reality Using HoloLens.使用HoloLens的增强现实交互式分子图形
J Integr Bioinform. 2018 Jun 13;15(2):20180005. doi: 10.1515/jib-2018-0005.
9
Unraveling the Design Space of Immersive Analytics: A Systematic Review.剖析沉浸式分析的设计空间:一项系统综述
IEEE Trans Vis Comput Graph. 2023 Oct 25;PP. doi: 10.1109/TVCG.2023.3327368.
10
Towards a hybrid user interface for the visual exploration of large biomolecular networks using virtual reality.使用虚拟现实技术实现大型生物分子网络可视化探索的混合用户界面
J Integr Bioinform. 2022 Oct 11;19(4). doi: 10.1515/jib-2022-0034. eCollection 2022 Dec 1.

引用本文的文献

1
Blending space and time to talk about cancer in extended reality.融合空间与时间,在扩展现实中探讨癌症。
NPJ Digit Med. 2024 Sep 29;7(1):261. doi: 10.1038/s41746-024-01262-x.
2
Methods in DNA methylation array dataset analysis: A review.DNA甲基化阵列数据集分析方法:综述
Comput Struct Biotechnol J. 2024 May 17;23:2304-2325. doi: 10.1016/j.csbj.2024.05.015. eCollection 2024 Dec.
3
Understanding cancer patient cohorts in virtual reality environment for better clinical decisions: a usability study.在虚拟现实环境中理解癌症患者队列,以做出更好的临床决策:一项可用性研究。

本文引用的文献

1
Transcriptional profiles of different states of cancer stem cells in triple-negative breast cancer.三阴性乳腺癌中不同状态的癌症干细胞的转录谱。
Mol Cancer. 2018 Feb 23;17(1):65. doi: 10.1186/s12943-018-0809-x.
2
Personalized medicine-a modern approach for the diagnosis and management of hypertension.个性化医疗——高血压诊断与管理的现代方法。
Clin Sci (Lond). 2017 Nov 6;131(22):2671-2685. doi: 10.1042/CS20160407. Print 2017 Nov 15.
3
Short DNA sequence patterns accurately identify broadly active human enhancers.短DNA序列模式可准确识别广泛活跃的人类增强子。
BMC Med Inform Decis Mak. 2023 Dec 20;23(1):295. doi: 10.1186/s12911-023-02392-0.
4
Virtual reality for the observation of oncology models (VROOM): immersive analytics for oncology patient cohorts.虚拟现实观察肿瘤模型(VROOM):肿瘤患者队列的沉浸式分析。
Sci Rep. 2022 Jul 5;12(1):11337. doi: 10.1038/s41598-022-15548-1.
5
MonaGO: a novel gene ontology enrichment analysis visualisation system.MonaGO:一种新颖的基因本体论富集分析可视化系统。
BMC Bioinformatics. 2022 Feb 14;23(1):69. doi: 10.1186/s12859-022-04594-1.
6
STENCIL: A web templating engine for visualizing and sharing life science datasets.模板:用于可视化和共享生命科学数据集的网络模板引擎。
PLoS Comput Biol. 2022 Feb 9;18(2):e1009859. doi: 10.1371/journal.pcbi.1009859. eCollection 2022 Feb.
7
Exploring the Genomic Landscape of Cancer Patient Cohorts with GenVisR.利用 GenVisR 探索癌症患者队列的基因组景观。
Curr Protoc. 2021 Sep;1(9):e252. doi: 10.1002/cpz1.252.
8
Tasks, Techniques, and Tools for Genomic Data Visualization.基因组数据可视化的任务、技术和工具。
Comput Graph Forum. 2019 Jun;38(3):781-805. doi: 10.1111/cgf.13727. Epub 2019 Jul 10.
BMC Genomics. 2017 Jul 17;18(1):536. doi: 10.1186/s12864-017-3934-9.
4
Enhancing knowledge discovery from cancer genomics data with Galaxy.利用Galaxy增强从癌症基因组学数据中进行的知识发现。
Gigascience. 2017 May 1;6(5):1-13. doi: 10.1093/gigascience/gix015.
5
Application of Machine-Learning Models to Predict Tacrolimus Stable Dose in Renal Transplant Recipients.机器学习模型在预测肾移植受者他克莫司稳定剂量中的应用。
Sci Rep. 2017 Feb 8;7:42192. doi: 10.1038/srep42192.
6
StratomeX: Visual Analysis of Large-Scale Heterogeneous Genomics Data for Cancer Subtype Characterization.StratomeX:用于癌症亚型特征描述的大规模异构基因组数据可视化分析
Comput Graph Forum. 2012 Jun;31(33):1175-1184. doi: 10.1111/j.1467-8659.2012.03110.x. Epub 2012 Jun 25.
7
Complex heatmaps reveal patterns and correlations in multidimensional genomic data.复杂热图揭示多维基因组数据中的模式和相关性。
Bioinformatics. 2016 Sep 15;32(18):2847-9. doi: 10.1093/bioinformatics/btw313. Epub 2016 May 20.
8
AstraZeneca launches project to sequence 2 million genomes.阿斯利康启动对200万个基因组进行测序的项目。
Nature. 2016 Apr 28;532(7600):427. doi: 10.1038/nature.2016.19797.
9
VarDict: a novel and versatile variant caller for next-generation sequencing in cancer research.VarDict:一种用于癌症研究中下一代测序的新型多功能变异检测工具。
Nucleic Acids Res. 2016 Jun 20;44(11):e108. doi: 10.1093/nar/gkw227. Epub 2016 Apr 7.
10
Visualizing genome and systems biology: technologies, tools, implementation techniques and trends, past, present and future.可视化基因组与系统生物学:技术、工具、实施方法及趋势,过去、现在与未来
Gigascience. 2015 Aug 25;4:38. doi: 10.1186/s13742-015-0077-2. eCollection 2015.