School of Computer, Data and Mathematical Sciences, Western Sydney University, Parramatta, Australia.
Samurai Punk, Melbourne, Australia.
Sci Rep. 2022 Jul 5;12(1):11337. doi: 10.1038/s41598-022-15548-1.
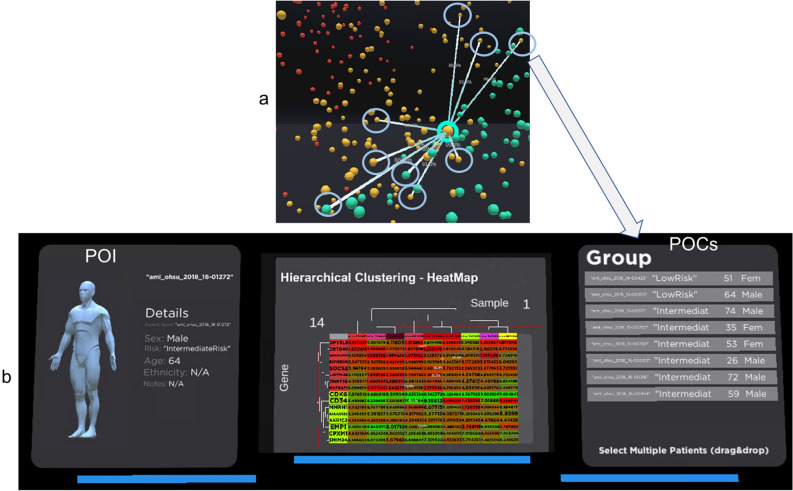
The significant advancement of inexpensive and portable virtual reality (VR) and augmented reality devices has re-energised the research in the immersive analytics field. The immersive environment is different from a traditional 2D display used to analyse 3D data as it provides a unified environment that supports immersion in a 3D scene, gestural interaction, haptic feedback and spatial audio. Genomic data analysis has been used in oncology to understand better the relationship between genetic profile, cancer type, and treatment option. This paper proposes a novel immersive analytics tool for cancer patient cohorts in a virtual reality environment, virtual reality to observe oncology data models. We utilise immersive technologies to analyse the gene expression and clinical data of a cohort of cancer patients. Various machine learning algorithms and visualisation methods have also been deployed in VR to enhance the data interrogation process. This is supported with established 2D visual analytics and graphical methods in bioinformatics, such as scatter plots, descriptive statistical information, linear regression, box plot and heatmap into our visualisation. Our approach allows the clinician to interrogate the information that is familiar and meaningful to them while providing them immersive analytics capabilities to make new discoveries toward personalised medicine.
廉价便携的虚拟现实 (VR) 和增强现实设备的显著进步重新激发了沉浸式分析领域的研究。沉浸式环境与用于分析 3D 数据的传统 2D 显示器不同,因为它提供了一个统一的环境,支持沉浸在 3D 场景中、手势交互、触觉反馈和空间音频。基因组数据分析已在肿瘤学中用于更好地理解遗传特征、癌症类型和治疗方案之间的关系。本文提出了一种在虚拟现实环境中用于癌症患者队列的新型沉浸式分析工具,即虚拟现实观察肿瘤学数据模型。我们利用沉浸式技术分析了一组癌症患者的基因表达和临床数据。还在 VR 中部署了各种机器学习算法和可视化方法来增强数据查询过程。这得到了生物信息学中已建立的 2D 可视化分析和图形方法的支持,例如散点图、描述性统计信息、线性回归、箱线图和热图,将它们纳入我们的可视化中。我们的方法允许临床医生查询对他们来说熟悉且有意义的信息,同时为他们提供沉浸式分析功能,以朝着个性化医疗方向进行新的发现。