Epidemiology and Public Health, University College London, London, UK.
BMJ Open. 2019 Apr 20;9(4):e025309. doi: 10.1136/bmjopen-2018-025309.
To explore age trajectories of body mass index (BMI) and waist circumference (WC) and to examine whether these trajectories varied by wealth.
Nationally representative prospective cohort study.
Observational study of people living in England.
7416 participants aged 52 and over of the English Longitudinal Study of Ageing (2004-2012).
BMI and WC assessed objectively by a trained nurse.
Total non-pension household wealth quintiles defined as financial wealth, physical wealth (such as business wealth, land or jewels) and housing wealth (primary and secondary residential housing wealth), minus debts.
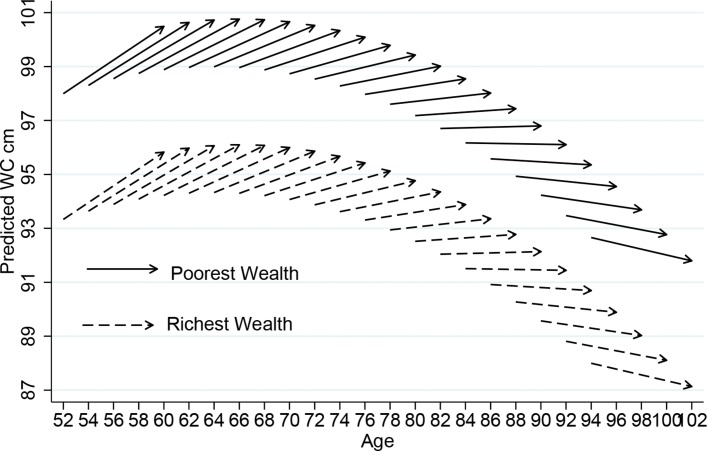
Using latent growth curve models, we showed that BMI increased by 0.03 kg/m (95% CI 0.02 to 0.04, p<0.001) per year and WC by 0.18 cm (95% CI 0.15 to 0.22, p<0.001). Age (linear and quadratic) showed a negative association with BMI and WC baseline and rates of change, indicating that older individuals had smaller body sizes and that the positive rates of change flattened to eventually become negative. The decline occurred around the age of 71 years for BMI and 80 years for WC. Poorest wealth was significantly related to higher baseline levels of BMI (1.97 kg/m 95% CI 0.99 to 1.55, p<0.001) and WC (4.66 cm 95% CI 3.68 to 2.40, p<0.001). However, no significant difference was found in the rate of change of BMI and WC by wealth, meaning that the age trajectories of BMI and WC were parallel across wealth categories and that the socioeconomic gap did not close at older ages.
Older English adults showed an increase in BMI and WC over time but this trend reversed at older old age to display a sharp decrease. At any given age wealthier people had more favourable BMI and WC profile.
探索体重指数(BMI)和腰围(WC)的年龄轨迹,并研究这些轨迹是否因财富而异。
全国代表性的前瞻性队列研究。
英国观察性研究中居住的人群。
英国老龄化纵向研究(2004-2012 年)中 7416 名年龄在 52 岁及以上的参与者。
由经过培训的护士客观评估 BMI 和 WC。
总非养老金家庭财富五分位数定义为金融财富、实物财富(如商业财富、土地或珠宝)和住房财富(主要和次要住宅住房财富),减去债务。
使用潜在增长曲线模型,我们发现 BMI 每年增加 0.03kg/m(95%CI 0.02 至 0.04,p<0.001),WC 增加 0.18cm(95%CI 0.15 至 0.22,p<0.001)。年龄(线性和二次)与 BMI 和 WC 基线和变化率呈负相关,表明年龄较大的个体体型较小,而正变化率趋于平缓,最终变为负。这种下降发生在 BMI 约 71 岁和 WC 约 80 岁时。最贫穷的财富与 BMI 的较高基线水平(1.97kg/m,95%CI 0.99 至 1.55,p<0.001)和 WC(4.66cm,95%CI 3.68 至 2.40,p<0.001)显著相关。然而,财富对 BMI 和 WC 变化率的影响没有显著差异,这意味着 BMI 和 WC 的年龄轨迹在财富类别之间是平行的,而且社会经济差距并没有在老年时缩小。
英国老年人的 BMI 和 WC 随时间呈上升趋势,但这一趋势在老年时逆转,显示出急剧下降。在任何给定年龄,较富裕的人 BMI 和 WC 状况更理想。