• 文献检索
  • 文档翻译
  • 深度研究
  • 学术资讯
  • Suppr Zotero 插件Zotero 插件
  • 邀请有礼
  • 套餐&价格
  • 历史记录
应用&插件
Suppr Zotero 插件Zotero 插件浏览器插件Mac 客户端Windows 客户端微信小程序
定价
高级版会员购买积分包购买API积分包
服务
文献检索文档翻译深度研究API 文档MCP 服务
关于我们
关于 Suppr公司介绍联系我们用户协议隐私条款
关注我们

Suppr 超能文献

核心技术专利:CN118964589B侵权必究
粤ICP备2023148730 号-1Suppr @ 2026

文献检索

告别复杂PubMed语法,用中文像聊天一样搜索,搜遍4000万医学文献。AI智能推荐,让科研检索更轻松。

立即免费搜索

文件翻译

保留排版,准确专业,支持PDF/Word/PPT等文件格式,支持 12+语言互译。

免费翻译文档

深度研究

AI帮你快速写综述,25分钟生成高质量综述,智能提取关键信息,辅助科研写作。

立即免费体验

基于谷歌地球引擎的2000年至2015年三峡水库集水区土地利用变化与气候变化

Land Use Change and Climate Variation in the Three Gorges Reservoir Catchment from 2000 to 2015 Based on the Google Earth Engine.

作者信息

Hao Binfei, Ma Mingguo, Li Shiwei, Li Qiuping, Hao Dalei, Huang Jing, Ge Zhongxi, Yang Hong, Han Xujun

机构信息

Research Base of Karst Eco-Environments at Nanchuan in Chongqing, Ministry of Nature Resources, Chongqing Key Laboratory of Karst Environment, School of Geographical Sciences, Southwest University, Chongqing 400715, China.

Chongqing Engineering Research Center for Remote Sensing Big Data Application, School of Geographical Sciences, Southwest University, Chongqing 400715, China.

出版信息

Sensors (Basel). 2019 May 7;19(9):2118. doi: 10.3390/s19092118.

DOI:10.3390/s19092118
PMID:31067808
原文链接:https://pmc.ncbi.nlm.nih.gov/articles/PMC6540281/
Abstract

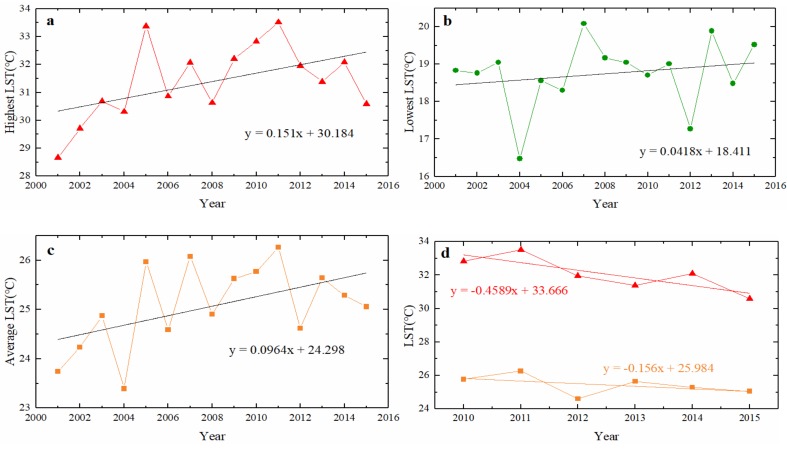
Possible environmental change and ecosystem degradation have received increasing attention since the construction of Three Gorges Reservoir Catchment (TGRC) in China. The advanced Google Earth Engine (GEE) cloud-based platform and the large number of Geosciences and Remote Sensing datasets archived in GEE were used to analyze the land use and land cover change (LULCC) and climate variation in TGRC. GlobeLand30 data were used to evaluate the spatial land dynamics from 2000 to 2010 and Landsat 8 Operational Land Imager (OLI) images were applied for land use in 2015. The interannual variations in the Land Surface Temperature (LST) and seasonally integrated normalized difference vegetation index (SINDVI) were estimated using Moderate Resolution Imaging Spectroradiometer (MODIS) products. The climate factors including air temperature, precipitation and evapotranspiration were investigated based on the data from the Global Land Data Assimilation System (GLDAS). The results indicated that from 2000 to 2015, the cultivated land and grassland decreased by 2.05% and 6.02%, while the forest, wetland, artificial surface, shrub land and waterbody increased by 3.64%, 0.94%, 0.87%, 1.17% and 1.45%, respectively. The SINDVI increased by 3.209 in the period of 2000-2015, while the LST decreased by 0.253 °C from 2001 to 2015. The LST showed an increasing trend primarily in urbanized area, with a decreasing trend mainly in forest area. In particular, Chongqing City had the highest LST during the research period. A marked decrease in SINDVI occurred primarily in urbanized areas. Good vegetation areas were primarily located in the eastern part of the TGRC, such as Wuxi County, Wushan County, and Xingshan County. During the 2000-2015 period, the air temperature, precipitation and evapotranspiration rose by 0.0678 °C/a, 1.0844 mm/a, and 0.4105 mm/a, respectively. The climate change in the TGRC was influenced by LULCC, but the effect was limited. What is more, the climate change was affected by regional climate change in Southwest China. Marked changes in land use have occurred in the TGRC, and they have resulted in changes in the LST and SINDVI. There was a significantly negative relationship between LST and SINDVI in most parts of the TGRC, especially in expanding urban areas and growing forest areas. Our study highlighted the importance of environmental protection, particularly proper management of land use, for sustainable development in the catchment.

摘要

自中国三峡水库集水区(TGRC)建设以来,可能的环境变化和生态系统退化受到了越来越多的关注。先进的基于谷歌地球引擎(GEE)的云平台以及GEE中存档的大量地球科学和遥感数据集被用于分析TGRC的土地利用和土地覆盖变化(LULCC)以及气候变化。GlobeLand30数据用于评估2000年至2010年的空间土地动态,Landsat 8 业务陆地成像仪(OLI)图像用于2015年的土地利用情况。利用中分辨率成像光谱仪(MODIS)产品估算地表温度(LST)和季节性综合归一化植被指数(SINDVI)的年际变化。基于全球陆地数据同化系统(GLDAS)的数据,对气温、降水和蒸散等气候因子进行了研究。结果表明,2000年至2015年,耕地和草地分别减少了2.05%和6.02%,而森林、湿地、人工表面、灌木林和水体分别增加了3.64%、0.94%、0.87%、1.17%和1.45%。2000 - 2015年期间,SINDVI增加了3.209,而2001年至2015年LST下降了0.253℃。LST主要在城市化地区呈上升趋势,主要在森林地区呈下降趋势。特别是在研究期间,重庆市的LST最高。SINDVI的显著下降主要发生在城市化地区。植被良好的地区主要位于TGRC的东部,如巫溪县、巫山县和兴山县。在2000 - 2015年期间,气温、降水和蒸散分别以每年0.0678℃、1.0844毫米和0.4105毫米的速度上升。TGRC的气候变化受LULCC影响,但影响有限。此外,气候变化还受到中国西南地区区域气候变化的影响。TGRC发生了显著的土地利用变化,并导致了LST和SINDVI的变化。在TGRC的大部分地区,尤其是在扩张的城市地区和增长的森林地区,LST和SINDVI之间存在显著的负相关关系。我们的研究强调了环境保护的重要性,特别是土地利用的合理管理,对于集水区可持续发展的重要性。

https://cdn.ncbi.nlm.nih.gov/pmc/blobs/fe08/6540281/7b6ed383f4b0/sensors-19-02118-g012.jpg
https://cdn.ncbi.nlm.nih.gov/pmc/blobs/fe08/6540281/b4cef4c62232/sensors-19-02118-g001.jpg
https://cdn.ncbi.nlm.nih.gov/pmc/blobs/fe08/6540281/422f0a72a01a/sensors-19-02118-g002.jpg
https://cdn.ncbi.nlm.nih.gov/pmc/blobs/fe08/6540281/175b67e7ac8d/sensors-19-02118-g003.jpg
https://cdn.ncbi.nlm.nih.gov/pmc/blobs/fe08/6540281/fce99ef6264b/sensors-19-02118-g004.jpg
https://cdn.ncbi.nlm.nih.gov/pmc/blobs/fe08/6540281/e0c972de8a28/sensors-19-02118-g005a.jpg
https://cdn.ncbi.nlm.nih.gov/pmc/blobs/fe08/6540281/4c3fef6b30dd/sensors-19-02118-g006.jpg
https://cdn.ncbi.nlm.nih.gov/pmc/blobs/fe08/6540281/811657000520/sensors-19-02118-g007.jpg
https://cdn.ncbi.nlm.nih.gov/pmc/blobs/fe08/6540281/b5d0c57a8d0b/sensors-19-02118-g008.jpg
https://cdn.ncbi.nlm.nih.gov/pmc/blobs/fe08/6540281/58f96f327c59/sensors-19-02118-g009.jpg
https://cdn.ncbi.nlm.nih.gov/pmc/blobs/fe08/6540281/14475b5fb143/sensors-19-02118-g010a.jpg
https://cdn.ncbi.nlm.nih.gov/pmc/blobs/fe08/6540281/e274f0fbaea9/sensors-19-02118-g011.jpg
https://cdn.ncbi.nlm.nih.gov/pmc/blobs/fe08/6540281/7b6ed383f4b0/sensors-19-02118-g012.jpg

相似文献

1
Land Use Change and Climate Variation in the Three Gorges Reservoir Catchment from 2000 to 2015 Based on the Google Earth Engine.基于谷歌地球引擎的2000年至2015年三峡水库集水区土地利用变化与气候变化
Sensors (Basel). 2019 May 7;19(9):2118. doi: 10.3390/s19092118.
2
Understanding the linkages between spatio-temporal urban land system changes and land surface temperature in Srinagar City, India, using image archives from Google Earth Engine.利用谷歌地球引擎中的图像档案,了解印度斯利那加市时空城市土地系统变化与地表温度之间的联系。
Environ Sci Pollut Res Int. 2023 Oct;30(49):107281-107295. doi: 10.1007/s11356-023-28889-9. Epub 2023 Jul 26.
3
Examining the relationship between land surface temperature and landscape features using spectral indices with Google Earth Engine.利用谷歌地球引擎的光谱指数研究地表温度与景观特征之间的关系。
Heliyon. 2022 Sep 18;8(9):e10668. doi: 10.1016/j.heliyon.2022.e10668. eCollection 2022 Sep.
4
Land use/land cover change and land surface temperature of Ibadan and environs, Nigeria.尼日利亚伊巴丹及其周边地区的土地利用/土地覆盖变化和地表温度。
Environ Monit Assess. 2020 Jan 13;192(2):109. doi: 10.1007/s10661-019-8054-3.
5
Effect of landscape pattern changes and environmental indices on land surface temperature in a fragile ecosystem in southeastern Iran.伊朗东南部脆弱生态系统景观格局变化及其环境指数对地表温度的影响。
Environ Sci Pollut Res Int. 2023 Mar;30(12):34037-34053. doi: 10.1007/s11356-022-24602-4. Epub 2022 Dec 12.
6
Analyzing Land Use/Land Cover Changes Using Google Earth Engine and Random Forest Algorithm and Their Implications to the Management of Land Degradation in the Upper Tekeze Basin, Ethiopia.利用谷歌地球引擎和随机森林算法分析埃塞俄比亚上特克泽河流域的土地利用/土地覆盖变化及其对土地退化管理的影响
ScientificWorldJournal. 2024 Jul 30;2024:3937558. doi: 10.1155/2024/3937558. eCollection 2024.
7
Land use land cover and land surface temperature changes and their relationship with human modification in Islamabad Capital Territory, Pakistan.巴基斯坦伊斯兰堡首都辖区土地利用/土地覆被变化及土地表面温度变化及其与人类活动的关系。
Braz J Biol. 2024 Aug 12;84:e281700. doi: 10.1590/1519-6984.281700. eCollection 2024.
8
An integrated approach of remote sensing and geospatial analysis for modeling and predicting the impacts of climate change on food security.遥感和地理空间分析的综合方法,用于建模和预测气候变化对粮食安全的影响。
Sci Rep. 2023 Jan 19;13(1):1057. doi: 10.1038/s41598-023-28244-5.
9
Time-series dataset on land surface temperature, vegetation, built up areas and other climatic factors in top 20 global cities (2000-2018).全球前20大城市(2000年至2018年)的地表温度、植被、建成区及其他气候因素的时间序列数据集。
Data Brief. 2019 Mar 12;23:103803. doi: 10.1016/j.dib.2019.103803. eCollection 2019 Apr.
10
Urban green space mediates spatiotemporal variation in land surface temperature: a case study of an urbanized city, Bangladesh.城市绿地调节地表温度的时空变化:以孟加拉国一个城市化城市为例
Environ Sci Pollut Res Int. 2022 May;29(24):36376-36391. doi: 10.1007/s11356-021-17480-9. Epub 2022 Jan 21.

引用本文的文献

1
Driving Force Analysis of Natural Wetland in Northeast Plain Based on SSA-XGBoost Model.基于 SSA-XGBoost 模型的东北平原天然湿地驱动力分析。
Sensors (Basel). 2023 Aug 29;23(17):7513. doi: 10.3390/s23177513.
2
Monitoring and Landscape Dynamic Analysis of Alpine Wetland Area Based on Multiple Algorithms: A Case Study of Zoige Plateau.基于多种算法的高寒湿地面积监测与景观动态分析——以若尔盖高原为例
Sensors (Basel). 2020 Dec 19;20(24):7315. doi: 10.3390/s20247315.

本文引用的文献

1
Urban heat island: Aerodynamics or imperviousness?城市热岛效应:空气动力学还是不透水性?
Sci Adv. 2019 Apr 3;5(4):eaau4299. doi: 10.1126/sciadv.aau4299. eCollection 2019 Apr.
2
[Long-term changes of land use/cover in the Three Gorges Reservoir Area of the Yangtze River, China.].[中国长江三峡库区土地利用/覆盖的长期变化。]
Ying Yong Sheng Tai Xue Bao. 2018 May;29(5):1585-1596. doi: 10.13287/j.1001-9332.201805.012.
3
Spatial-Temporal Variation of Drought in China from 1982 to 2010 Based on a modified Temperature Vegetation Drought Index (mTVDI).
基于改进型温度植被干旱指数(mTVDI)的1982—2010年中国干旱时空变化
Sci Rep. 2017 Dec 12;7(1):17473. doi: 10.1038/s41598-017-17810-3.
4
Evaluation of low impact development approach for mitigating flood inundation at a watershed scale in China.评价中国流域尺度缓解洪泛的低影响开发方法。
J Environ Manage. 2017 May 15;193:430-438. doi: 10.1016/j.jenvman.2017.02.020. Epub 2017 Feb 23.
5
Carbon emissions from land-use change and management in China between 1990 and 2010.中国 1990 年至 2010 年土地利用变化和管理的碳排放。
Sci Adv. 2016 Nov 2;2(11):e1601063. doi: 10.1126/sciadv.1601063. eCollection 2016 Nov.
6
NDVI indicated long-term interannual changes in vegetation activities and their responses to climatic and anthropogenic factors in the Three Gorges Reservoir Region, China.归一化植被指数(NDVI)表明了中国三峡库区植被活动的长期年际变化及其对气候和人为因素的响应。
Sci Total Environ. 2017 Jan 1;574:947-959. doi: 10.1016/j.scitotenv.2016.09.049. Epub 2016 Oct 14.
7
China's soil plan needs strong support.中国的土壤计划需要大力支持。
Nature. 2016 Aug 25;536(7617):375. doi: 10.1038/536375a.
8
Impact of land use type conversion on carbon storage in terrestrial ecosystems of China: A spatial-temporal perspective.土地利用类型转换对中国陆地生态系统碳储量的影响:时空视角
Sci Rep. 2015 May 15;5:10233. doi: 10.1038/srep10233.
9
Enforcement key to China's environment.
Science. 2015 Feb 20;347(6224):834-5. doi: 10.1126/science.347.6224.834-d.
10
China: Open access to Earth land-cover map.中国:地球土地覆盖图开放获取。
Nature. 2014 Oct 23;514(7523):434. doi: 10.1038/514434c.