• 文献检索
  • 文档翻译
  • 深度研究
  • 学术资讯
  • Suppr Zotero 插件Zotero 插件
  • 邀请有礼
  • 套餐&价格
  • 历史记录
应用&插件
Suppr Zotero 插件Zotero 插件浏览器插件Mac 客户端Windows 客户端微信小程序
定价
高级版会员购买积分包购买API积分包
服务
文献检索文档翻译深度研究API 文档MCP 服务
关于我们
关于 Suppr公司介绍联系我们用户协议隐私条款
关注我们

Suppr 超能文献

核心技术专利:CN118964589B侵权必究
粤ICP备2023148730 号-1Suppr @ 2026

文献检索

告别复杂PubMed语法,用中文像聊天一样搜索,搜遍4000万医学文献。AI智能推荐,让科研检索更轻松。

立即免费搜索

文件翻译

保留排版,准确专业,支持PDF/Word/PPT等文件格式,支持 12+语言互译。

免费翻译文档

深度研究

AI帮你快速写综述,25分钟生成高质量综述,智能提取关键信息,辅助科研写作。

立即免费体验

来自[具体名称1]和[具体名称2]的全磁盘数据的全局模式分析。

Global-Mode Analysis of Full-Disk Data from the and the .

作者信息

Larson Timothy P, Schou Jesper

机构信息

1Stanford University, Stanford, CA USA.

2Max-Planck-Institut für Sonnensystemforschung, Göttingen, Germany.

出版信息

Sol Phys. 2018;293(2):29. doi: 10.1007/s11207-017-1201-5. Epub 2018 Jan 31.

DOI:10.1007/s11207-017-1201-5
PMID:31258202
原文链接:https://pmc.ncbi.nlm.nih.gov/articles/PMC6566312/
Abstract

UNLABELLED

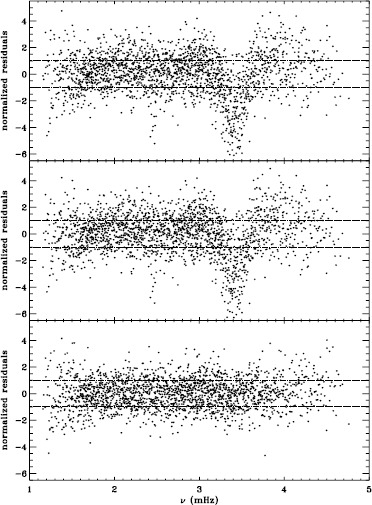
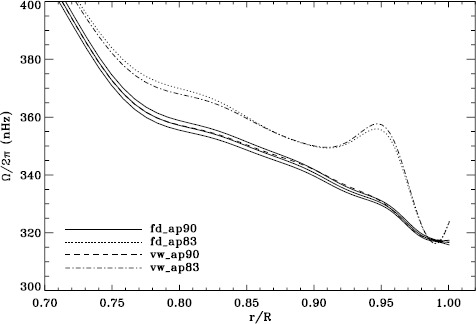
Building upon our previous work, in which we analyzed smoothed and subsampled velocity data from the (MDI), we extend our analysis to unsmoothed, full-resolution MDI data. We also present results from the (HMI), in both full resolution and processed to be a proxy for the low-resolution MDI data. We find that the systematic errors that we saw previously, namely peaks in both the high-latitude rotation rate and the normalized residuals of odd -coefficients, are almost entirely absent in the two full-resolution analyses. Furthermore, we find that both systematic errors seem to depend almost entirely on how the input images are apodized, rather than on resolution or smoothing. Using the full-resolution HMI data, we confirm our previous findings regarding the effect of using asymmetric profiles on mode parameters, and also find that they occasionally result in more stable fits. We also confirm our previous findings regarding discrepancies between 360-day and 72-day analyses. We further investigate a six-month period previously seen in -mode frequency shifts using the low-resolution datasets, this time accounting for solar-cycle dependence using magnetic-field data. Both HMI and MDI saw prominent six-month signals in the frequency shifts, but we were surprised to discover that the strongest signal at that frequency occurred in the mode coverage for the low-resolution proxy. Finally, a comparison of mode parameters from HMI and MDI shows that the frequencies and -coefficients agree closely, encouraging the concatenation of the two datasets.

ELECTRONIC SUPPLEMENTARY MATERIAL

The online version of this article (10.1007/s11207-017-1201-5) contains supplementary material, which is available to authorized users.

摘要

未标注

基于我们之前的工作(在该工作中我们分析了来自[具体名称未给出](MDI)的平滑和下采样速度数据),我们将分析扩展到未平滑的全分辨率MDI数据。我们还展示了[具体名称未给出](HMI)的结果,包括全分辨率数据以及处理后作为低分辨率MDI数据代理的数据。我们发现,我们之前看到的系统误差,即在高纬度旋转率和奇数[系数未明确给出]系数的归一化残差中出现的峰值,在这两个全分辨率分析中几乎完全不存在。此外,我们发现这两个系统误差似乎几乎完全取决于输入图像的切趾方式,而不是分辨率或平滑处理。使用全分辨率HMI数据,我们证实了之前关于使用不对称轮廓对模式参数影响的发现,并且还发现它们偶尔会导致更稳定的拟合。我们还证实了之前关于360天和72天分析之间差异的发现。我们使用低分辨率数据集进一步研究了之前在[模式未明确给出]模式频率偏移中看到的一个六个月周期,这次使用磁场数据考虑了太阳周期依赖性。HMI和MDI在频率偏移中都看到了显著的六个月信号,但我们惊讶地发现,在该频率下最强的信号出现在低分辨率代理的模式覆盖范围内。最后,对HMI和MDI模式参数的比较表明,频率和[系数未明确给出]系数非常一致,这鼓励了将这两个数据集合并。

电子补充材料

本文的在线版本(10.1007/s11207-017-1201-5)包含补充材料,可供授权用户使用。

https://cdn.ncbi.nlm.nih.gov/pmc/blobs/90ca/11090818/1c796c5fd35f/11207_2017_1201_Fig30_HTML.jpg
https://cdn.ncbi.nlm.nih.gov/pmc/blobs/90ca/11090818/bb828b4c7082/11207_2017_1201_Fig1_HTML.jpg
https://cdn.ncbi.nlm.nih.gov/pmc/blobs/90ca/11090818/4020a5c7cf88/11207_2017_1201_Fig2_HTML.jpg
https://cdn.ncbi.nlm.nih.gov/pmc/blobs/90ca/11090818/12239bf3d000/11207_2017_1201_Fig3_HTML.jpg
https://cdn.ncbi.nlm.nih.gov/pmc/blobs/90ca/11090818/3a4da6769ec3/11207_2017_1201_Fig4_HTML.jpg
https://cdn.ncbi.nlm.nih.gov/pmc/blobs/90ca/11090818/2c2085ad2239/11207_2017_1201_Fig5_HTML.jpg
https://cdn.ncbi.nlm.nih.gov/pmc/blobs/90ca/11090818/c6199cc1b15d/11207_2017_1201_Fig6_HTML.jpg
https://cdn.ncbi.nlm.nih.gov/pmc/blobs/90ca/11090818/d3f791dfd9b4/11207_2017_1201_Fig7_HTML.jpg
https://cdn.ncbi.nlm.nih.gov/pmc/blobs/90ca/11090818/466083dd40b6/11207_2017_1201_Fig8_HTML.jpg
https://cdn.ncbi.nlm.nih.gov/pmc/blobs/90ca/11090818/93149be61ced/11207_2017_1201_Fig9_HTML.jpg
https://cdn.ncbi.nlm.nih.gov/pmc/blobs/90ca/11090818/940a72155c19/11207_2017_1201_Fig10_HTML.jpg
https://cdn.ncbi.nlm.nih.gov/pmc/blobs/90ca/11090818/2a4068d233fa/11207_2017_1201_Fig11_HTML.jpg
https://cdn.ncbi.nlm.nih.gov/pmc/blobs/90ca/11090818/e8578886ec7f/11207_2017_1201_Fig12_HTML.jpg
https://cdn.ncbi.nlm.nih.gov/pmc/blobs/90ca/11090818/ffd2c94921d8/11207_2017_1201_Fig13_HTML.jpg
https://cdn.ncbi.nlm.nih.gov/pmc/blobs/90ca/11090818/f58ee221e621/11207_2017_1201_Fig14_HTML.jpg
https://cdn.ncbi.nlm.nih.gov/pmc/blobs/90ca/11090818/0ab3911489bc/11207_2017_1201_Fig15_HTML.jpg
https://cdn.ncbi.nlm.nih.gov/pmc/blobs/90ca/11090818/e8a180c86959/11207_2017_1201_Fig16_HTML.jpg
https://cdn.ncbi.nlm.nih.gov/pmc/blobs/90ca/11090818/addd9d803055/11207_2017_1201_Fig17_HTML.jpg
https://cdn.ncbi.nlm.nih.gov/pmc/blobs/90ca/11090818/5b7d6015dc6a/11207_2017_1201_Fig18_HTML.jpg
https://cdn.ncbi.nlm.nih.gov/pmc/blobs/90ca/11090818/f62165063c35/11207_2017_1201_Fig19_HTML.jpg
https://cdn.ncbi.nlm.nih.gov/pmc/blobs/90ca/11090818/95d59f0baf84/11207_2017_1201_Fig20_HTML.jpg
https://cdn.ncbi.nlm.nih.gov/pmc/blobs/90ca/11090818/c8a717ec3e69/11207_2017_1201_Fig21_HTML.jpg
https://cdn.ncbi.nlm.nih.gov/pmc/blobs/90ca/11090818/4526485e1e5d/11207_2017_1201_Fig22_HTML.jpg
https://cdn.ncbi.nlm.nih.gov/pmc/blobs/90ca/11090818/78e4cf02f49b/11207_2017_1201_Fig23_HTML.jpg
https://cdn.ncbi.nlm.nih.gov/pmc/blobs/90ca/11090818/fb1cdfebc36b/11207_2017_1201_Fig24_HTML.jpg
https://cdn.ncbi.nlm.nih.gov/pmc/blobs/90ca/11090818/01f8514b3989/11207_2017_1201_Fig25_HTML.jpg
https://cdn.ncbi.nlm.nih.gov/pmc/blobs/90ca/11090818/9f6b927a7ab2/11207_2017_1201_Fig26_HTML.jpg
https://cdn.ncbi.nlm.nih.gov/pmc/blobs/90ca/11090818/4dbe622a7a3f/11207_2017_1201_Fig27_HTML.jpg
https://cdn.ncbi.nlm.nih.gov/pmc/blobs/90ca/11090818/90b64aa2dfd4/11207_2017_1201_Fig28_HTML.jpg
https://cdn.ncbi.nlm.nih.gov/pmc/blobs/90ca/11090818/b2182cfdf499/11207_2017_1201_Fig29_HTML.jpg
https://cdn.ncbi.nlm.nih.gov/pmc/blobs/90ca/11090818/1c796c5fd35f/11207_2017_1201_Fig30_HTML.jpg

相似文献

1
Global-Mode Analysis of Full-Disk Data from the and the .来自[具体名称1]和[具体名称2]的全磁盘数据的全局模式分析。
Sol Phys. 2018;293(2):29. doi: 10.1007/s11207-017-1201-5. Epub 2018 Jan 31.
2
Statistical Properties of Ribbon Evolution and Reconnection Electric Fields in Eruptive and Confined Flares.爆发性耀斑和受限耀斑中色带演化及重联电场的统计特性
Sol Phys. 2018;293(3):38. doi: 10.1007/s11207-018-1253-1. Epub 2018 Feb 15.
3
Helioseismic measurement of solar torsional oscillations.太阳扭转振荡的日震测量。
Science. 2002 Apr 5;296(5565):101-3. doi: 10.1126/science.1069190.
4
The (HMI) Vector Magnetic Field Pipeline: Magnetohydrodynamics Simulation Module for the Global Solar Corona.(HMI)矢量磁场管道:全球日冕的磁流体动力学模拟模块。
Sol Phys. 2015;290(5):1507-1529. doi: 10.1007/s11207-015-0686-z. Epub 2015 Apr 23.
5
On-Orbit Performance of the Instrument onboard the .[具体航天器名称]上仪器的在轨性能
Sol Phys. 2018;293(3):45. doi: 10.1007/s11207-018-1259-8. Epub 2018 Feb 23.
6
Probing the Solar Meridional Circulation Using Fourier Legendre Decomposition.利用傅里叶-勒让德分解探测太阳子午环流
Astrophys J. 2021 Apr 16;911(1). doi: 10.3847/1538-4357/abe7e4. Epub 2021 Apr 15.
7
Investigation of the Middle Corona with SWAP and a Data-Driven Non-Potential Coronal Magnetic Field Model.利用日冕物质抛射分析程序(SWAP)和数据驱动的非势日冕磁场模型对日冕中部进行研究。
Sol Phys. 2020;295(7):101. doi: 10.1007/s11207-020-01668-2. Epub 2020 Jul 27.
8
Numerical Simulations of Oscillation Modes of the Solar Convection Zone.太阳对流层振荡模式的数值模拟
Astrophys J. 2000 Feb 20;530(2):L139-L142. doi: 10.1086/312490.
9
In Search of Emerging Magnetic Flux underneath the Solar Surface with Acoustic Imaging.利用声学成像寻找太阳表面下新出现的磁通量。
Astrophys J. 1999 Nov 20;526(1):L53-L56. doi: 10.1086/312366.
10
Oscillations observed in umbra, plage, quiet-Sun and the polarity inversion line of active region 11158 using Helioseismic Magnetic Imager/Solar Dynamics Observatory data.利用日震磁成像仪/太阳动力学天文台数据在11158活动区的本影、谱斑、宁静太阳和极性反转线上观测到的振荡。
Philos Trans A Math Phys Eng Sci. 2021 Feb 8;379(2190):20200175. doi: 10.1098/rsta.2020.0175. Epub 2020 Dec 21.

引用本文的文献

1
Helioseismic inference of the solar radiative opacity.太阳辐射不透明度的日震学推断。
Nat Commun. 2025 Jan 27;16(1):693. doi: 10.1038/s41467-024-54793-y.
2
Dynamics of Large-Scale Solar Flows.大规模太阳气流的动力学
Space Sci Rev. 2023;219(8):77. doi: 10.1007/s11214-023-01021-6. Epub 2023 Nov 17.
3
Simulations of Solar and Stellar Dynamos and Their Theoretical Interpretation.太阳和恒星发电机的模拟及其理论解释。
Space Sci Rev. 2023;219(7):58. doi: 10.1007/s11214-023-01005-6. Epub 2023 Oct 11.
4
Rotation suppresses giant-scale solar convection.旋转抑制了太阳巨型尺度的对流。
Proc Natl Acad Sci U S A. 2021 Aug 3;118(31). doi: 10.1073/pnas.2022518118.
5
Turbulence in the Sun is suppressed on large scales and confined to equatorial regions.太阳中的湍流在大尺度上受到抑制,并局限于赤道区域。
Sci Adv. 2020 Jul 22;6(30):eaba9639. doi: 10.1126/sciadv.aba9639. eCollection 2020 Jul.