Diao Jian-Dong, Wu Chun-Jiao, Cui Hong-Xia, Bu Ming-Wei, Yue Dan, Wang Xue, Liu Yan-Ling, Yang Yong-Jing
Department of Oncology and Hematology, China-Japan Union Hospital of Jilin University.
Departments of Oncology.
Medicine (Baltimore). 2019 Nov;98(46):e17916. doi: 10.1097/MD.0000000000017916.
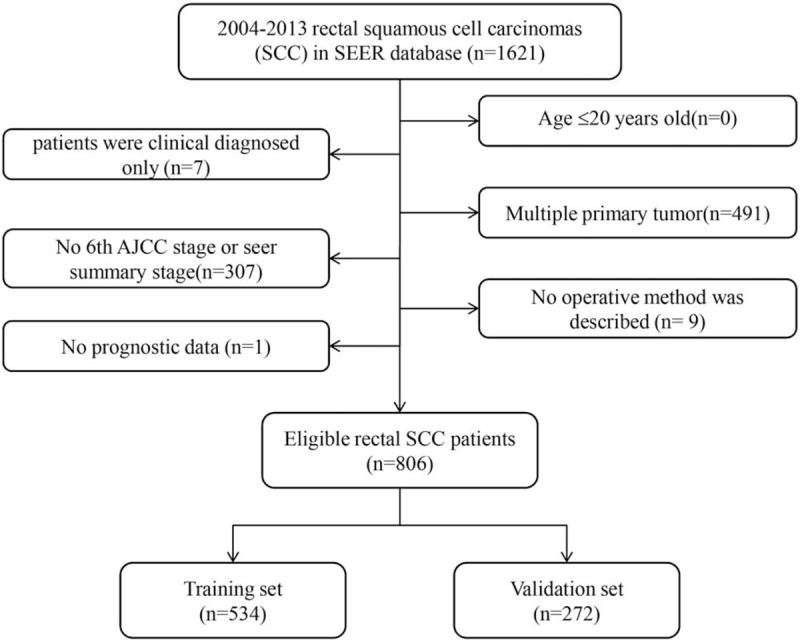
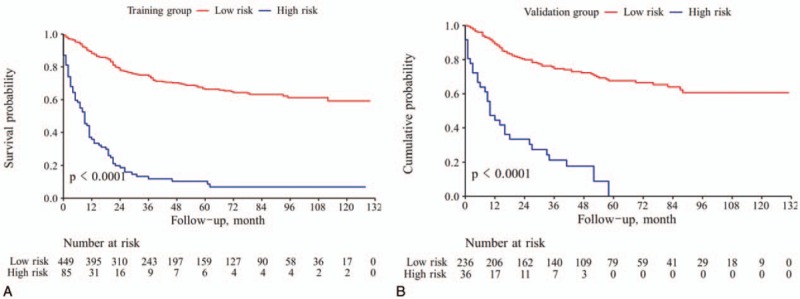
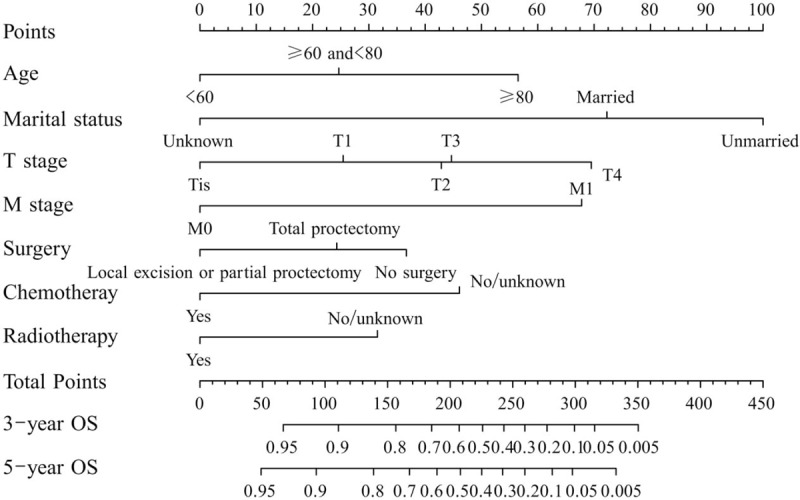
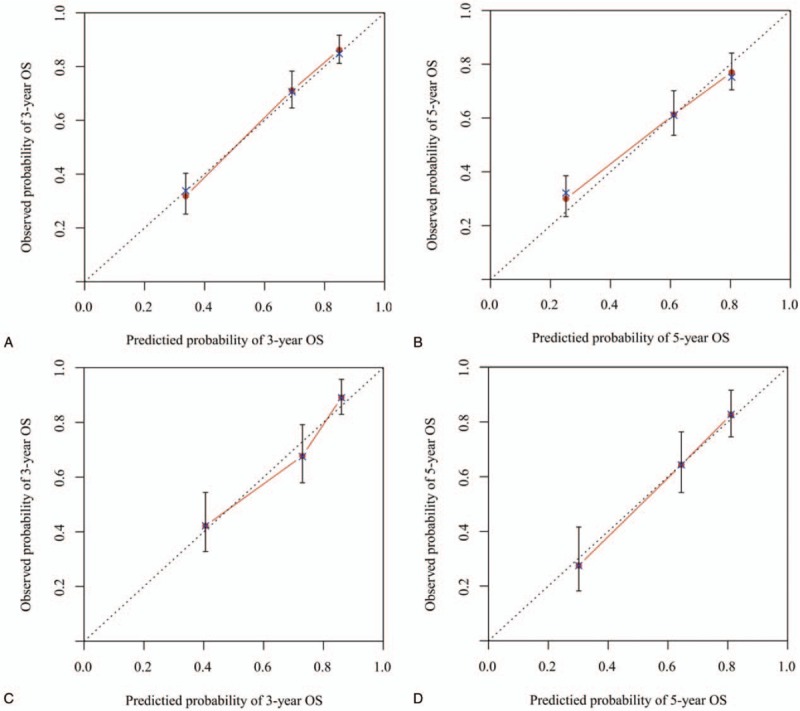
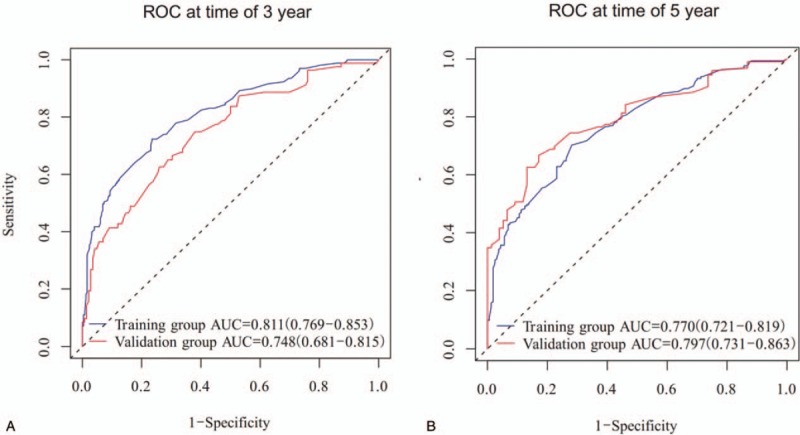
We aimed to evaluate the prognostic value of clinical and pathologic factors in rectal squamous cell carcinomas (SCC) and to construct a nomogram for their outcome prediction.The study cohort was selected from Surveillance, Epidemiology, and End Results (SEER) program between January 2004 and December 2013. Univariate and multivariate analyses were performed using Cox proportional hazards regression model to evaluate the prognostic value of involved variables. All prognostic factors were combined to construct a nomogram to predict the overall survival (OS), followed by discrimination as well as calibration plots and receiver operating characteristic (ROC) curves for assessing the predictive accuracy of the nomogram.We identified 806 patients with a median follow-up time of 35 months. Multivariate analyses revealed that marital status (P < .001), age (P < .001), T stage (P = .008), M stage (P < .001), surgery (P = .004), chemotherapy (P = .003) and radiotherapy (P = .016) were independent prognostic factors of OS. Finally, the 7 variables were combined to construct a 3-year and 5-year OS nomogram. The concordance indexes (C-indexes) of OS were 0.756 (95% CI, 0.726-0.786) for the internal validation and 0.729 (95% CI, 0.678-0.780) for the external validation. Additionally, there was superior discrimination power of the nomogram over the SEER stage or the 8th edition AJCC TNM staging classification (P < .001). Calibration plots further showed good consistency between the nomogram prediction and actual observation. The area under the curve (AUC) of ROC curves for 3-year OS was 0.811 (95% CI: 0.769-0.853) in the training cohort and 0.748 (95% CI: 0.681-0.815) in the validation cohort. The AUC for 5-year OS was 0.770 (95% CI: 0.721-0.819) in the training cohort and 0.797 (95% CI: 0.731-0.863) in the validation cohort. Finally, Kaplan-Meier analysis further validates the predictive potential of the nomogram.Marital status, age, T stage, M stage, surgery, chemotherapy and radiotherapy were significantly associated with OS of patients with rectal SCC. This predictive model has the potential to provide an individualized risk estimate of survival in patients with rectal SCC.
我们旨在评估临床和病理因素对直肠鳞状细胞癌(SCC)的预后价值,并构建一个列线图来预测其预后。研究队列选自2004年1月至2013年12月的监测、流行病学和最终结果(SEER)计划。使用Cox比例风险回归模型进行单因素和多因素分析,以评估相关变量的预后价值。将所有预后因素结合起来构建一个列线图,以预测总生存期(OS),随后进行区分度分析以及校准图和受试者工作特征(ROC)曲线分析,以评估列线图的预测准确性。
我们确定了806例患者,中位随访时间为35个月。多因素分析显示,婚姻状况(P<0.001)、年龄(P<0.001)、T分期(P = 0.008)、M分期(P<0.001)、手术(P = 0.004)、化疗(P = 0.003)和放疗(P = 0.016)是OS的独立预后因素。最后,将这7个变量结合起来构建一个3年和5年OS列线图。内部验证时OS的一致性指数(C指数)为0.756(95%CI,0.726 - 0.786),外部验证时为0.729(95%CI,0.678 - 0.780)。此外,列线图的区分能力优于SEER分期或第8版美国癌症联合委员会(AJCC)TNM分期分类(P<0.001)。校准图进一步显示列线图预测与实际观察之间具有良好的一致性。训练队列中3年OS的ROC曲线下面积(AUC)为0.811(95%CI:0.769 - 0.853),验证队列中为0.748(95%CI:0.681 - 0.815)。5年OS的AUC在训练队列中为0.770(95%CI:0.721 - 0.819),在验证队列中为0.797(95%CI:0.731 - 0.863)。最后,Kaplan - Meier分析进一步验证了列线图的预测潜力。
婚姻状况、年龄、T分期、M分期、手术、化疗和放疗与直肠SCC患者的OS显著相关。这个预测模型有可能为直肠SCC患者提供个性化的生存风险估计。