• 文献检索
  • 文档翻译
  • 深度研究
  • 学术资讯
  • Suppr Zotero 插件Zotero 插件
  • 邀请有礼
  • 套餐&价格
  • 历史记录
应用&插件
Suppr Zotero 插件Zotero 插件浏览器插件Mac 客户端Windows 客户端微信小程序
定价
高级版会员购买积分包购买API积分包
服务
文献检索文档翻译深度研究API 文档MCP 服务
关于我们
关于 Suppr公司介绍联系我们用户协议隐私条款
关注我们

Suppr 超能文献

核心技术专利:CN118964589B侵权必究
粤ICP备2023148730 号-1Suppr @ 2026

文献检索

告别复杂PubMed语法,用中文像聊天一样搜索,搜遍4000万医学文献。AI智能推荐,让科研检索更轻松。

立即免费搜索

文件翻译

保留排版,准确专业,支持PDF/Word/PPT等文件格式,支持 12+语言互译。

免费翻译文档

深度研究

AI帮你快速写综述,25分钟生成高质量综述,智能提取关键信息,辅助科研写作。

立即免费体验

利用陆地卫星 8 图像估算咖啡的叶水势。

Leaf water potential of coffee estimated by landsat-8 images.

机构信息

Pós-Graduação/Sensoriamento Remoto, Instituto Nacional de Pesquisas Espaciais, São José dos Campos, SP, Brasil.

Empresa de Pesquisa Agropecuária de Minas Gerais, Lavras, MG, Brazil.

出版信息

PLoS One. 2020 Mar 18;15(3):e0230013. doi: 10.1371/journal.pone.0230013. eCollection 2020.

DOI:10.1371/journal.pone.0230013
PMID:32187201
原文链接:https://pmc.ncbi.nlm.nih.gov/articles/PMC7080268/
Abstract

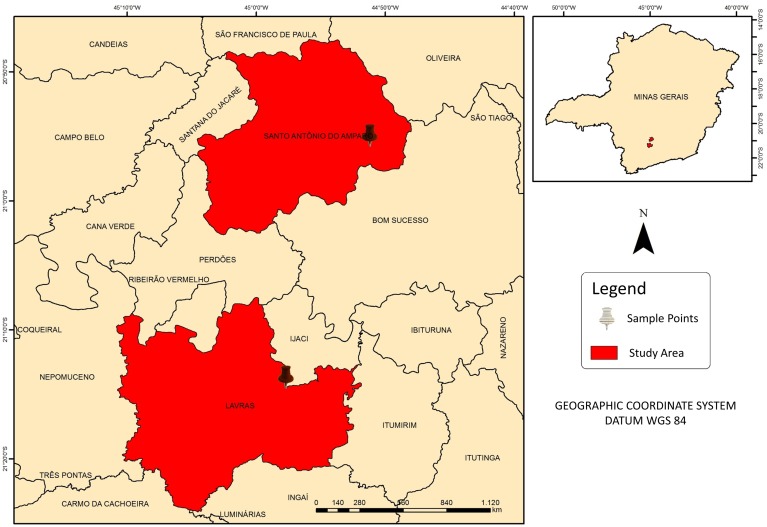
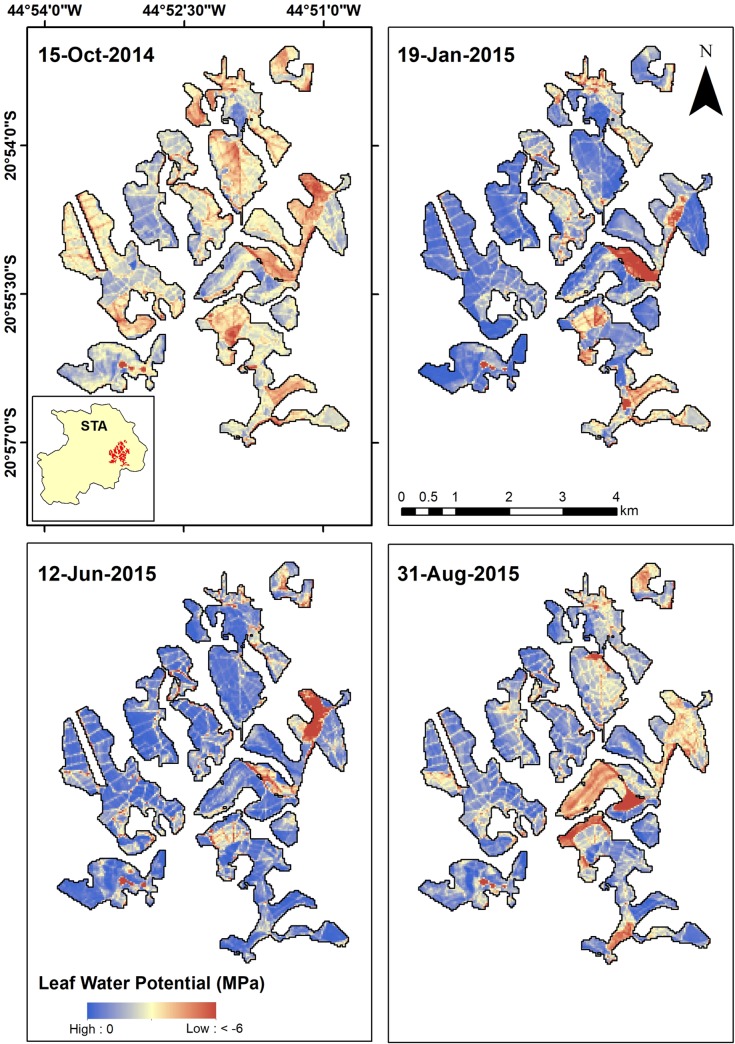
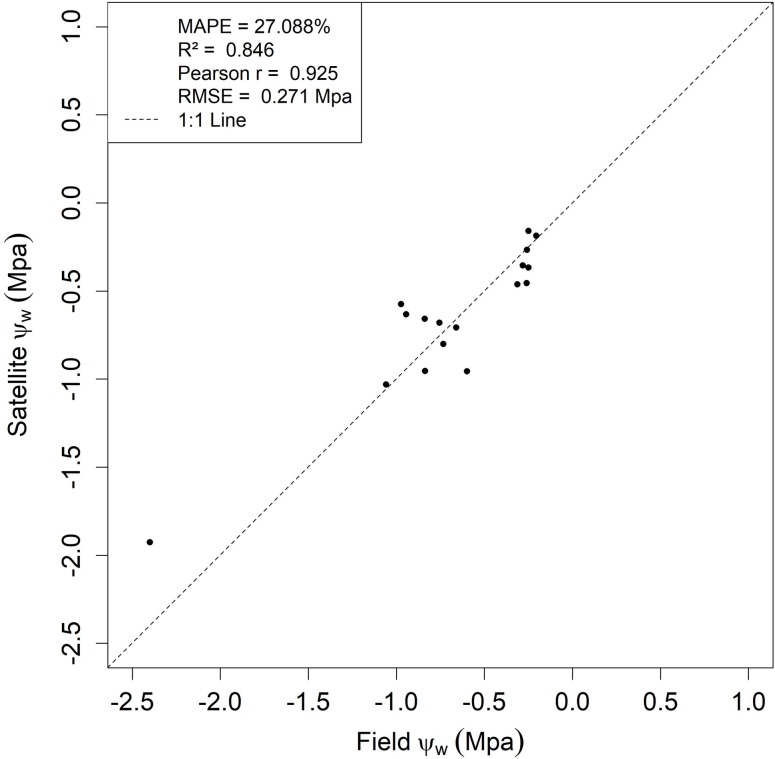
Traditionally, water conditions of coffee areas are monitored by measuring the leaf water potential (ΨW) throughout a pressure pump. However, there is a demand for the development of technologies that can estimate large areas or regions. In this context, the objective of this study was to estimate the ΨW by surface reflectance values and vegetation indices obtained from the Landsat-8/OLI sensor in Minas Gerais-Brazil Several algorithms using OLI bands and vegetation indexes were evaluated and from the correlation analysis, a quadratic algorithm that uses the Normalized Difference Vegetation Index (NDVI) performed better, with a correlation coefficient (R2) of 0.82. Leave-One-Out Cross-Validation (LOOCV) was performed to validate the models and the best results were for NDVI quadratic algorithm, presenting a Mean Absolute Percentage Error (MAPE) of 27.09% and an R2 of 0.85. Subsequently, the NDVI quadratic algorithm was applied to Landsat-8 images, aiming to spatialize the ΨW estimated in a representative area of regional coffee planting between September 2014 to July 2015. From the proposed algorithm, it was possible to estimate ΨW from Landsat-8/OLI imagery, contributing to drought monitoring in the coffee area leading to cost reduction to the producers.

摘要

传统上,通过在压力泵整个过程中测量叶片水势(ΨW)来监测咖啡区的水分条件。但是,人们需要开发可以估算大面积或区域的技术。在这种情况下,本研究的目的是利用从巴西米纳斯吉拉斯州获取的 Landsat-8/OLI 传感器的表面反射率值和植被指数来估算 ΨW。评估了几种使用 OLI 波段和植被指数的算法,通过相关分析,使用归一化差异植被指数(NDVI)的二次算法表现更好,相关系数(R2)为 0.82。进行了留一法交叉验证(LOOCV)以验证模型,NDVI 二次算法的结果最好,平均绝对百分比误差(MAPE)为 27.09%,R2 为 0.85。随后,将 NDVI 二次算法应用于 Landsat-8 图像,旨在对 2014 年 9 月至 2015 年 7 月之间具有代表性的地区咖啡种植区域内估算的 ΨW 进行空间化。通过所提出的算法,可以从 Landsat-8/OLI 图像中估算 ΨW,有助于监测咖啡区的干旱情况,从而降低生产者的成本。

https://cdn.ncbi.nlm.nih.gov/pmc/blobs/ddf7/7080268/47afa6114817/pone.0230013.g005.jpg
https://cdn.ncbi.nlm.nih.gov/pmc/blobs/ddf7/7080268/73f53284e557/pone.0230013.g001.jpg
https://cdn.ncbi.nlm.nih.gov/pmc/blobs/ddf7/7080268/8c16b4c603b3/pone.0230013.g002.jpg
https://cdn.ncbi.nlm.nih.gov/pmc/blobs/ddf7/7080268/997f938912e7/pone.0230013.g003.jpg
https://cdn.ncbi.nlm.nih.gov/pmc/blobs/ddf7/7080268/fef6955b6a23/pone.0230013.g004.jpg
https://cdn.ncbi.nlm.nih.gov/pmc/blobs/ddf7/7080268/47afa6114817/pone.0230013.g005.jpg

相似文献

1
Leaf water potential of coffee estimated by landsat-8 images.利用陆地卫星 8 图像估算咖啡的叶水势。
PLoS One. 2020 Mar 18;15(3):e0230013. doi: 10.1371/journal.pone.0230013. eCollection 2020.
2
Use of Landsat land surface temperature and vegetation indices for monitoring drought in the Salt Lake Basin Area, Turkey.利用陆地卫星陆地表面温度和植被指数监测土耳其盐湖盆地区的干旱情况。
ScientificWorldJournal. 2014 Jan 21;2014:142939. doi: 10.1155/2014/142939. eCollection 2014.
3
Monitoring Spatiotemporal Vegetation Response to Drought Using Remote Sensing Data.利用遥感数据监测时空植被对干旱的响应。
Sensors (Basel). 2023 Feb 14;23(4):2134. doi: 10.3390/s23042134.
4
Extraction of Long Time-Series Vegetation Indices from Combined Multisource Satellite Imagery.从多源卫星图像组合中提取长时间序列植被指数。
Comput Intell Neurosci. 2022 May 30;2022:3901372. doi: 10.1155/2022/3901372. eCollection 2022.
5
Predicting grain protein content of field-grown winter wheat with satellite images and partial least square algorithm.利用卫星图像和偏最小二乘法算法预测田间冬小麦的籽粒蛋白质含量。
PLoS One. 2020 Mar 11;15(3):e0228500. doi: 10.1371/journal.pone.0228500. eCollection 2020.
6
Characterization of Landsat-7 to Landsat-8 reflective wavelength and normalized difference vegetation index continuity.陆地卫星7号至陆地卫星8号反射波长及归一化植被指数连续性的特征分析
Remote Sens Environ. 2016 Jan 12;Volume 185(Iss 1):57-70. doi: 10.1016/j.rse.2015.12.024.
7
Satellite imagery and machine learning for identification of aridity risk in central Java Indonesia.利用卫星图像和机器学习识别印度尼西亚爪哇中部的干旱风险
PeerJ Comput Sci. 2021 May 18;7:e415. doi: 10.7717/peerj-cs.415. eCollection 2021.
8
[Impact of Vegetation Structure on Drought Indices Based on MODIS Spectrum].[基于MODIS光谱的植被结构对干旱指数的影响]
Guang Pu Xue Yu Guang Pu Fen Xi. 2015 Apr;35(4):982-6.
9
Detecting, extracting, and mapping of inland surface water using Landsat 8 Operational Land Imager: A case study of Pune district, India.利用 Landsat 8 陆地成像仪探测、提取和绘制内陆地表水:以印度浦那地区为例。
F1000Res. 2022 Jul 11;11:774. doi: 10.12688/f1000research.121740.1. eCollection 2022.
10
Analysis of vegetation dynamics, drought in relation with climate over South Asia from 1990 to 2011.分析 1990 年至 2011 年期间南亚的植被动态与气候干旱之间的关系。
Environ Sci Pollut Res Int. 2019 Apr;26(11):11470-11481. doi: 10.1007/s11356-019-04512-8. Epub 2019 Feb 26.

引用本文的文献

1
Leaf water potential of field crops estimated using NDVI in ground-based remote sensing-opportunities to increase prediction precision.利用地面遥感中的归一化植被指数(NDVI)估算大田作物叶片水势——提高预测精度的机遇
PeerJ. 2021 Aug 18;9:e12005. doi: 10.7717/peerj.12005. eCollection 2021.

本文引用的文献

1
Atmospheric Correction Inter-comparison eXercise.大气校正相互比较实验
Remote Sens (Basel). 2018 Feb;10(2):352. doi: 10.3390/rs10020352. Epub 2018 Feb 24.
2
Preliminary analysis of the performance of the Landsat 8/OLI land surface reflectance product.陆地卫星8号/OLI地表反射率产品性能的初步分析
Remote Sens Environ. 2016 Apr 28;Volume 185(Iss 2):46-56. doi: 10.1016/j.rse.2016.04.008.
3
Global relationships among traditional reflectance vegetation indices (NDVI and NDII), evapotranspiration (ET), and soil moisture variability on weekly timescales.
传统反射率植被指数(归一化植被指数和归一化差异红外指数)、蒸散量(ET)与每周时间尺度上土壤湿度变异性之间的全球关系。
Remote Sens Environ. 2018 Dec 15;219:339-352. doi: 10.1016/j.rse.2018.10.020. Epub 2018 Oct 24.
4
Physiological and Agronomic Performance of the Coffee Crop in the Context of Climate Change and Global Warming: A Review.气候变化和全球变暖背景下咖啡作物的生理和农艺性能:综述。
J Agric Food Chem. 2018 May 30;66(21):5264-5274. doi: 10.1021/acs.jafc.7b04537. Epub 2018 Mar 15.
5
Integration of remote sensing datasets for local scale assessment and prediction of drought.遥感数据集的整合用于小尺度干旱评估和预测。
Sci Total Environ. 2015 Feb 1;505:503-7. doi: 10.1016/j.scitotenv.2014.09.099. Epub 2014 Oct 22.
6
HYDROSTATIC PRESSURE AND OSMOTIC POTENTIAL IN LEAVES OF MANGROVES AND SOME OTHER PLANTS.红树林及其他一些植物叶片中的静水压力与渗透势
Proc Natl Acad Sci U S A. 1964 Jul;52(1):119-25. doi: 10.1073/pnas.52.1.119.