• 文献检索
  • 文档翻译
  • 深度研究
  • 学术资讯
  • Suppr Zotero 插件Zotero 插件
  • 邀请有礼
  • 套餐&价格
  • 历史记录
应用&插件
Suppr Zotero 插件Zotero 插件浏览器插件Mac 客户端Windows 客户端微信小程序
定价
高级版会员购买积分包购买API积分包
服务
文献检索文档翻译深度研究API 文档MCP 服务
关于我们
关于 Suppr公司介绍联系我们用户协议隐私条款
关注我们

Suppr 超能文献

核心技术专利:CN118964589B侵权必究
粤ICP备2023148730 号-1Suppr @ 2026

文献检索

告别复杂PubMed语法,用中文像聊天一样搜索,搜遍4000万医学文献。AI智能推荐,让科研检索更轻松。

立即免费搜索

文件翻译

保留排版,准确专业,支持PDF/Word/PPT等文件格式,支持 12+语言互译。

免费翻译文档

深度研究

AI帮你快速写综述,25分钟生成高质量综述,智能提取关键信息,辅助科研写作。

立即免费体验

美国本土饮用水硝酸盐违规的模式和预测。

Patterns and predictions of drinking water nitrate violations across the conterminous United States.

机构信息

U.S. EPA, Office of Research and Development, Center for Public Health and Environmental Assessment, Health & Environmental Effects Assessment Division, Washington, DC, USA.

U.S. EPA, Office of Research and Development, Center for Public Health and Environmental Assessment, Pacific Ecological Systems Division, Corvallis, OR, USA.

出版信息

Sci Total Environ. 2020 Jun 20;722:137661. doi: 10.1016/j.scitotenv.2020.137661. Epub 2020 Mar 5.

DOI:10.1016/j.scitotenv.2020.137661
PMID:32192969
原文链接:https://pmc.ncbi.nlm.nih.gov/articles/PMC8204728/
Abstract

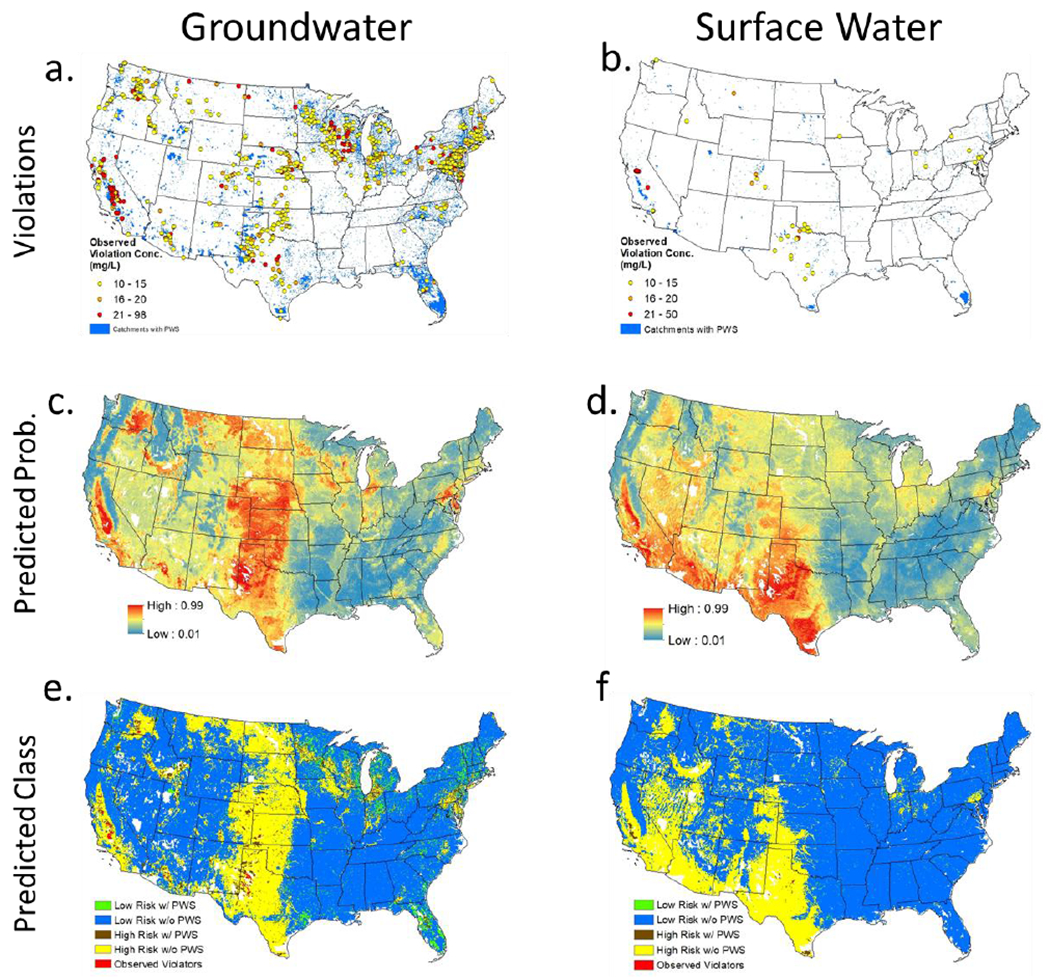
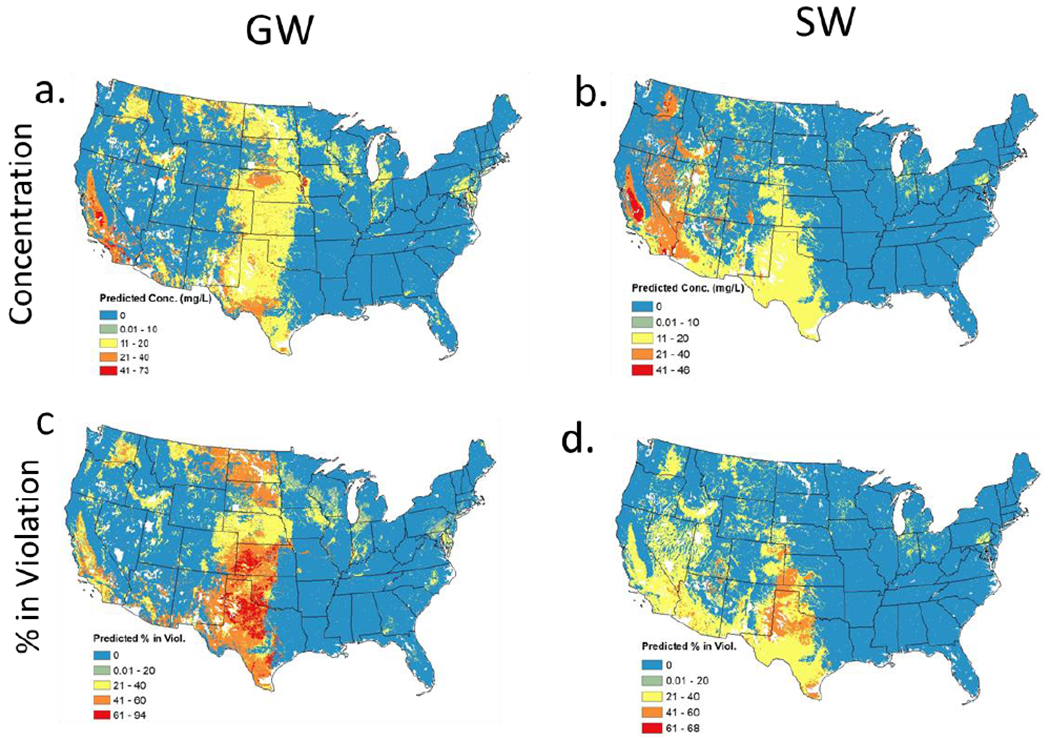
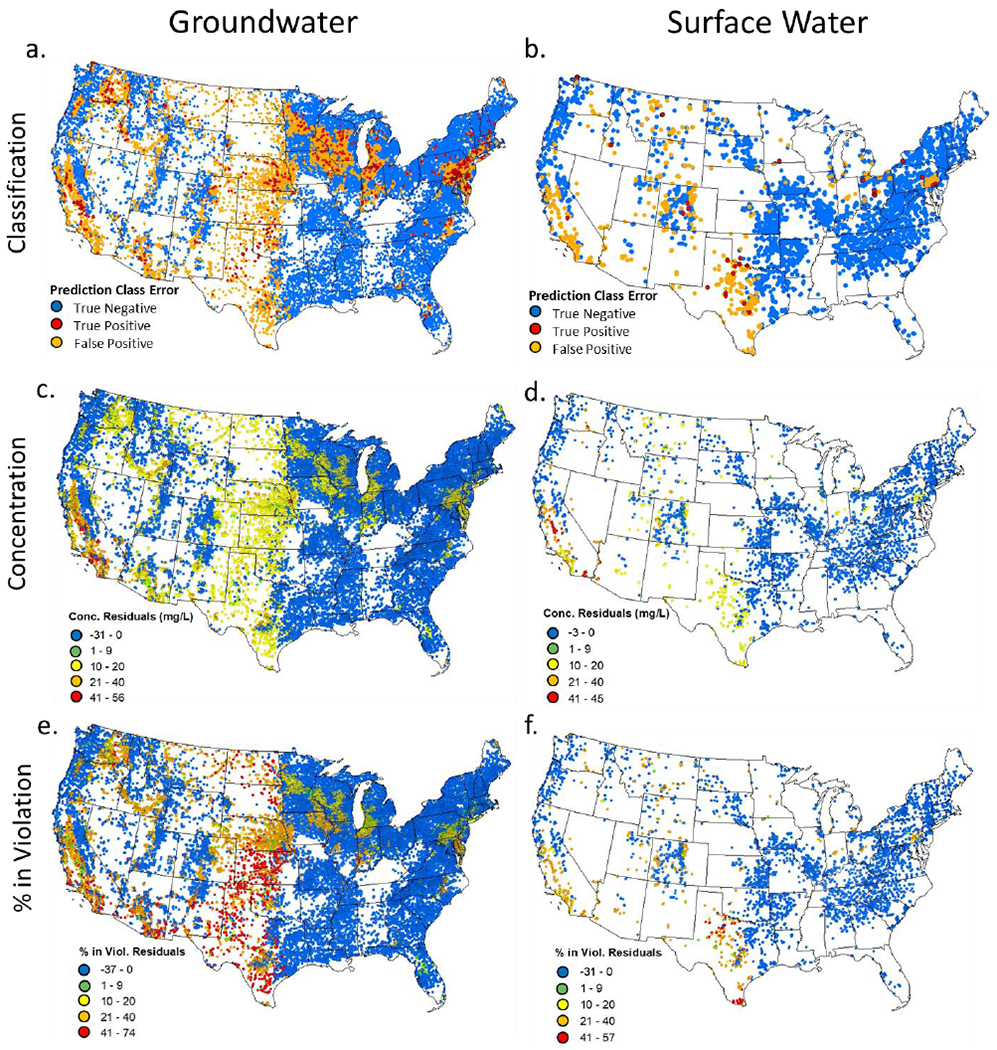
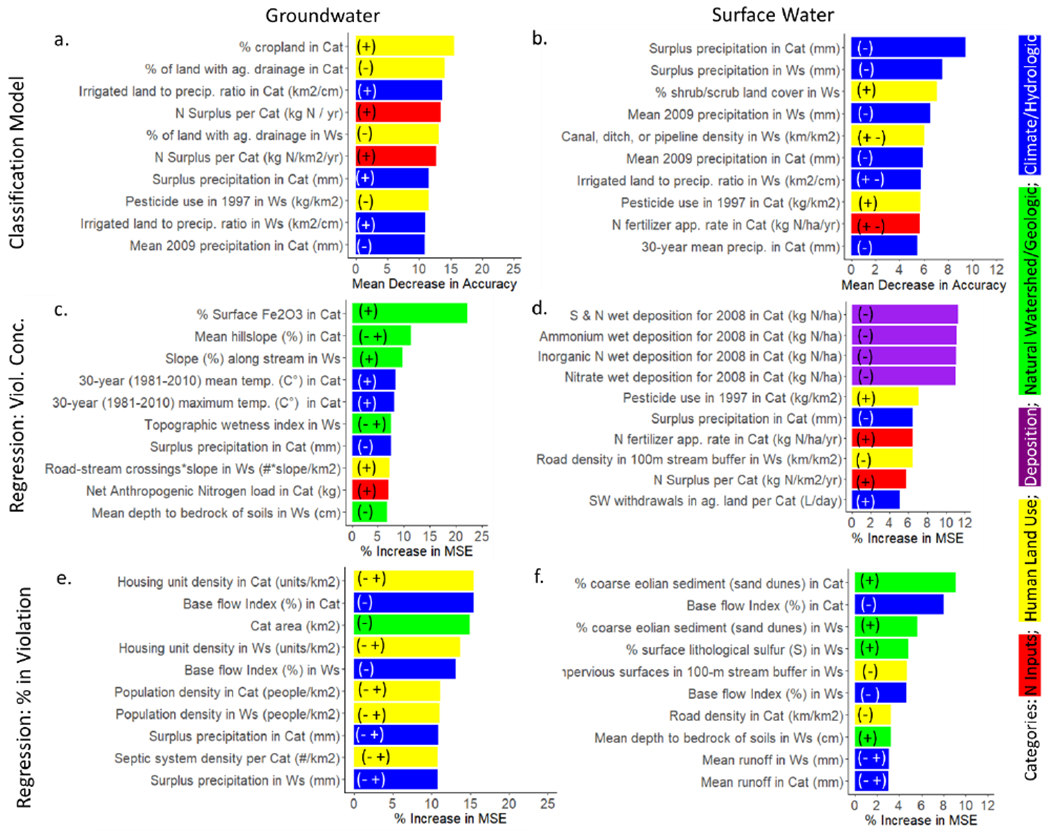
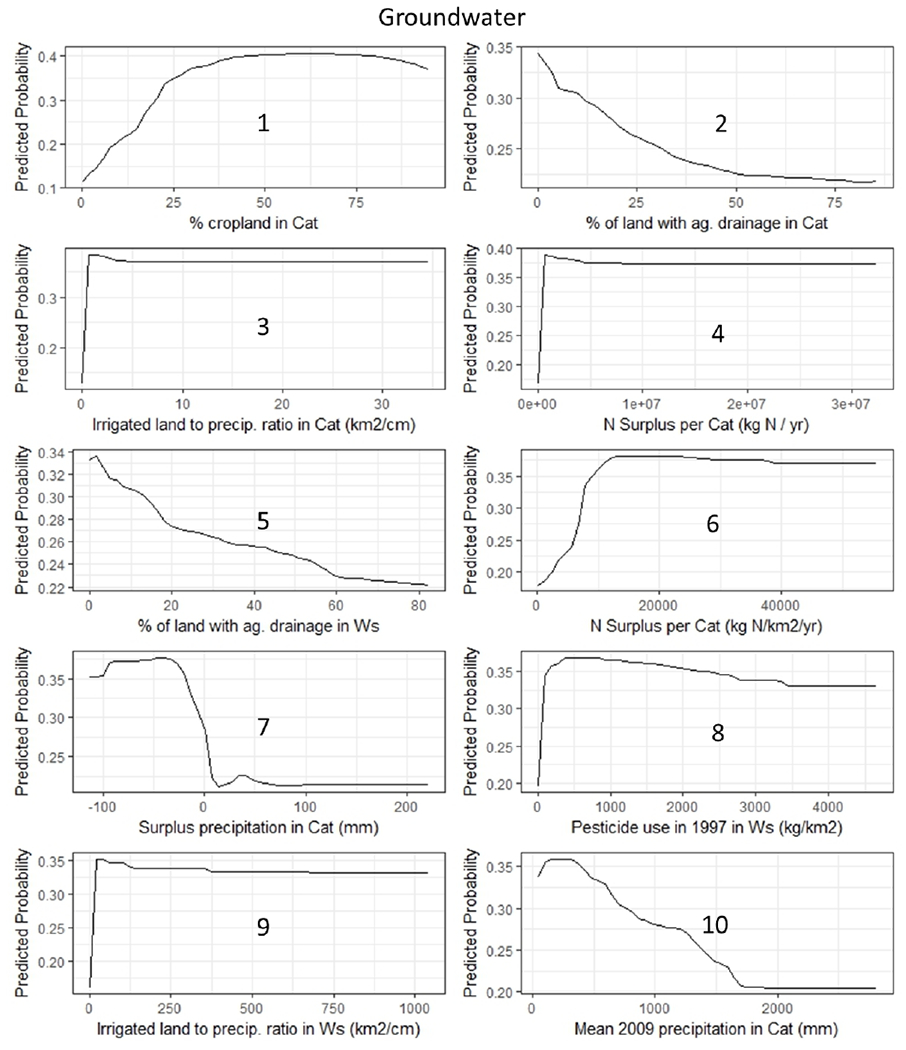
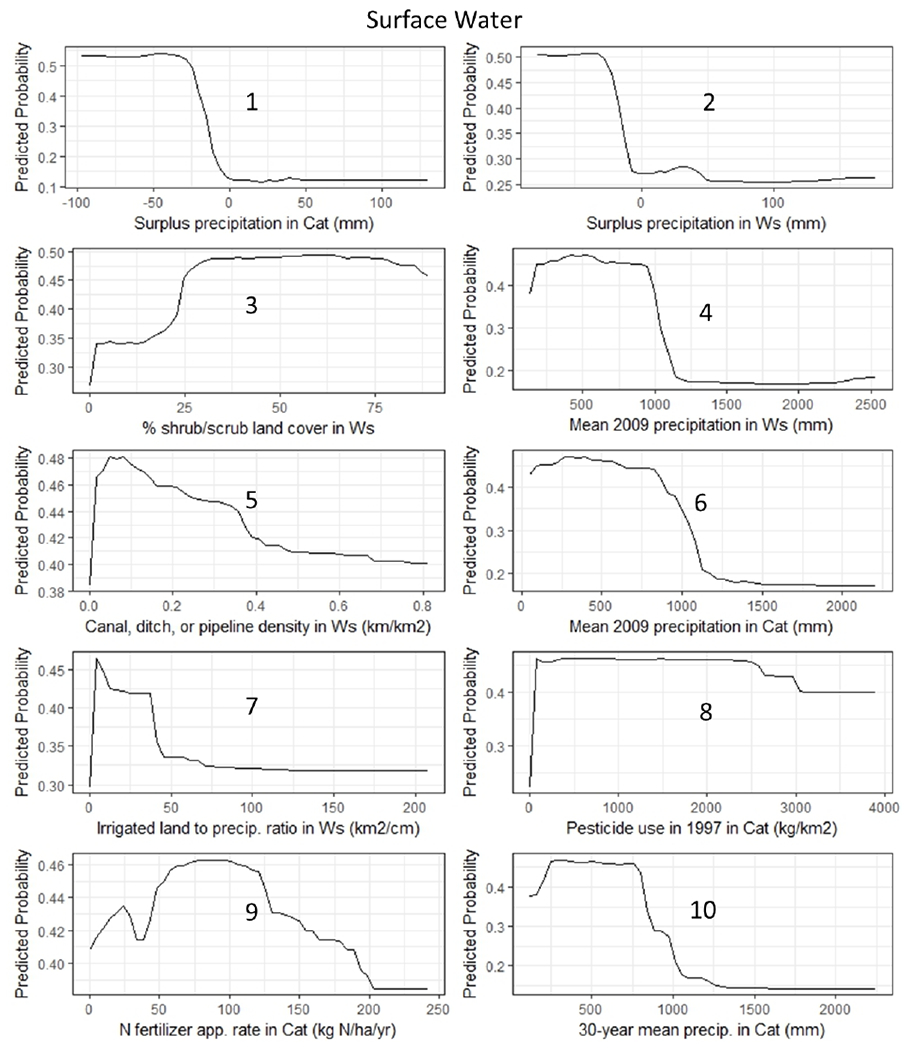
Excess nitrate in drinking water is a human health concern, especially for young children. Public drinking water systems in violation of the 10 mg nitrate-N/L maximum contaminant level (MCL) must be reported in EPA's Safe Drinking Water Information System (SDWIS). We used SDWIS data with random forest modeling to examine the drivers of nitrate violations across the conterminous U.S. and to predict where public water systems are at risk of exceeding the nitrate MCL. As explanatory variables, we used land cover, nitrogen inputs, soil/hydrogeology, and climate variables. While we looked at the role of nitrate treatment in separate analyses, we did not include treatment as a factor in the final models, due to incomplete information in SDWIS. For groundwater (GW) systems, a classification model correctly classified 79% of catchments in violation and a regression model explained 43% of the variation in nitrate concentrations above the MCL. The most important variables in the GW classification model were % cropland, agricultural drainage, irrigation-to-precipitation ratio, nitrogen surplus, and surplus precipitation. Regions predicted to have risk for nitrate violations in GW were the Central California Valley, parts of Washington, Idaho, the Great Plains, Piedmont of Pennsylvania and Coastal Plains of Delaware, and regions of Wisconsin, Iowa, and Minnesota. For surface water (SW) systems, a classification model correctly classified 90% of catchments and a regression model explained 52% of the variation in nitrate concentration. The variables most important for the SW classification model were largely hydroclimatic variables including surplus precipitation, irrigation-to-precipitation ratio, and % shrubland. Areas at greatest risk for SW nitrate violations were generally in the non-mountainous west and southwest. Identifying the areas with possible risk for future violations and potential drivers of nitrate violations across U.S. can inform decisions on how source water protection and other management options could best protect drinking water.

摘要

饮用水中过多的硝酸盐是一个对人类健康的关注问题,尤其是对幼儿而言。违反 10mg 硝酸盐氮/L 最大污染物水平 (MCL) 的公共饮用水系统必须在 EPA 的安全饮用水信息系统 (SDWIS) 中报告。我们使用 SDWIS 数据和随机森林模型来研究美国各地硝酸盐违规的驱动因素,并预测公共供水系统有哪些面临超过硝酸盐 MCL 的风险。作为解释变量,我们使用了土地覆盖、氮输入、土壤/水文地质和气候变量。虽然我们在单独的分析中研究了硝酸盐处理的作用,但由于 SDWIS 中的信息不完整,我们没有将处理作为最终模型的一个因素。对于地下水 (GW) 系统,分类模型正确分类了 79%的违规集水区,回归模型解释了硝酸盐浓度超过 MCL 的 43%的变化。GW 分类模型中最重要的变量是耕地百分比、农业排水、灌溉与降水比、氮盈余和盈余降水。预测 GW 硝酸盐违规风险的地区包括加利福尼亚中部山谷、华盛顿州、爱达荷州、大平原、宾夕法尼亚州皮埃蒙特和特拉华州沿海平原,以及威斯康星州、爱荷华州和明尼苏达州的部分地区。对于地表水 (SW) 系统,分类模型正确分类了 90%的集水区,回归模型解释了硝酸盐浓度变化的 52%。SW 分类模型最重要的变量主要是水文气候变量,包括盈余降水、灌溉与降水比和灌木百分比。地表水硝酸盐违规风险最大的地区通常在无山的西部和西南部。确定未来可能违规的地区和美国硝酸盐违规的潜在驱动因素,可以为水源保护和其他管理选项如何最好地保护饮用水的决策提供信息。

https://cdn.ncbi.nlm.nih.gov/pmc/blobs/fc3a/8204728/1cc0359c153d/nihms-1709384-f0006.jpg
https://cdn.ncbi.nlm.nih.gov/pmc/blobs/fc3a/8204728/d3358354bc02/nihms-1709384-f0001.jpg
https://cdn.ncbi.nlm.nih.gov/pmc/blobs/fc3a/8204728/2c992e75b315/nihms-1709384-f0002.jpg
https://cdn.ncbi.nlm.nih.gov/pmc/blobs/fc3a/8204728/fd03ddeaa46b/nihms-1709384-f0003.jpg
https://cdn.ncbi.nlm.nih.gov/pmc/blobs/fc3a/8204728/321762ffbeb2/nihms-1709384-f0004.jpg
https://cdn.ncbi.nlm.nih.gov/pmc/blobs/fc3a/8204728/1e72039d27cc/nihms-1709384-f0005.jpg
https://cdn.ncbi.nlm.nih.gov/pmc/blobs/fc3a/8204728/1cc0359c153d/nihms-1709384-f0006.jpg

相似文献

1
Patterns and predictions of drinking water nitrate violations across the conterminous United States.美国本土饮用水硝酸盐违规的模式和预测。
Sci Total Environ. 2020 Jun 20;722:137661. doi: 10.1016/j.scitotenv.2020.137661. Epub 2020 Mar 5.
2
Trends in Drinking Water Nitrate Violations Across the United States.美国饮用水硝酸盐违规趋势。
Environ Sci Technol. 2017 Nov 21;51(22):13450-13460. doi: 10.1021/acs.est.7b04269. Epub 2017 Nov 7.
3
Environmental justice and drinking water quality: are there socioeconomic disparities in nitrate levels in U.S. drinking water?环境公正与饮用水水质:美国饮用水中的硝酸盐水平是否存在社会经济差异?
Environ Health. 2019 Jan 17;18(1):3. doi: 10.1186/s12940-018-0442-6.
4
Wildfires can increase regulated nitrate, arsenic, and disinfection byproduct violations and concentrations in public drinking water supplies.野火会增加公共饮用水供应中受管制的硝酸盐、砷和消毒副产物的违规和浓度。
Sci Total Environ. 2022 Jan 15;804:149890. doi: 10.1016/j.scitotenv.2021.149890. Epub 2021 Aug 27.
5
Machine learning predictions of nitrate in groundwater used for drinking supply in the conterminous United States.机器学习预测美国本土饮用水供应地下水中的硝酸盐含量。
Sci Total Environ. 2022 Feb 10;807(Pt 3):151065. doi: 10.1016/j.scitotenv.2021.151065. Epub 2021 Oct 18.
6
Modeling groundwater nitrate concentrations in private wells in Iowa.模拟爱荷华州私人井中的地下水硝酸盐浓度。
Sci Total Environ. 2015 Dec 1;536:481-488. doi: 10.1016/j.scitotenv.2015.07.080. Epub 2015 Jul 30.
7
Nitrate exposure from drinking water and dietary sources among Iowa farmers using private wells.爱荷华州农民使用私人水井从饮用水和饮食来源中接触硝酸盐的情况。
Sci Total Environ. 2024 Apr 1;919:170922. doi: 10.1016/j.scitotenv.2024.170922. Epub 2024 Feb 11.
8
Quantifying the spatiotemporal variability of nitrate in irrigation water across the Wisconsin Central Sands.量化威斯康星中央沙丘地区灌溉水中硝酸盐的时空变异性。
J Environ Qual. 2023 Nov-Dec;52(6):1102-1114. doi: 10.1002/jeq2.20521. Epub 2023 Nov 9.
9
Arsenic Drinking Water Violations Decreased across the United States Following Revision of the Maximum Contaminant Level.砷饮用水违规在美国各地减少,因为最大污染物水平被修订。
Environ Sci Technol. 2019 Oct 1;53(19):11478-11485. doi: 10.1021/acs.est.9b02358. Epub 2019 Sep 10.
10
Impact of land cover on groundwater quality in the Upper Floridan Aquifer in Florida, United States.土地覆盖对美国佛罗里达州上佛罗里达含水层地下水质量的影响。
Environ Pollut. 2019 Sep;252(Pt B):1828-1840. doi: 10.1016/j.envpol.2019.06.054. Epub 2019 Jun 14.

引用本文的文献

1
Estimates of Lake Nitrogen, Phosphorus, and Chlorophyll- Concentrations to Characterize Harmful Algal Bloom Risk Across the United States.估算美国湖泊中的氮、磷和叶绿素浓度,以表征有害藻华风险。
Earths Future. 2024 Aug 26;12(8):e2024EF004493. doi: 10.1029/2024EF004493.
2
Changes in meat consumption can improve groundwater quality.肉类消费的变化可以改善地下水质量。
Nat Food. 2025 Jun 13. doi: 10.1038/s43016-025-01188-x.
3
Vadose zone flushing of fertilizer tracked by isotopes of water and nitrate.利用水和硝酸盐的同位素追踪肥料在渗流带的淋洗过程。

本文引用的文献

1
Seasonality of nitrogen balances in a Mediterranean climate watershed, Oregon, US.美国俄勒冈州地中海气候流域氮平衡的季节性变化
Biogeochemistry. 2018;142:247-264. doi: 10.1007/s10533-018-0532-0.
2
IMPROVING PREDICTIVE MODELS OF IN-STREAM PHOSPHORUS CONCENTRATION BASED ON NATIONALLY-AVAILABLE SPATIAL DATA COVERAGES.基于全国可用空间数据覆盖范围改进河流磷浓度预测模型。
J Am Water Resour Assoc. 2017 Aug;53(4):944-960. doi: 10.1111/1752-1688.12543.
3
Nitrogen inputs drive nitrogen concentrations in U.S. streams and rivers during summer low flow conditions.
Vadose Zone J. 2024 May 31;23(3):e20324. doi: 10.1002/vzj2.20324.
4
Nutrient Explorer: An analytical framework to visualize and investigate drivers of surface water quality.营养物质探索者:一个用于可视化和研究地表水水质驱动因素的分析框架。
Environ Model Softw. 2023 Dec;170. doi: 10.1016/j.envsoft.2023.105853.
5
Predicting Redox Conditions in Groundwater at a National Scale Using Random Forest Classification.利用随机森林分类法预测国家尺度地下水中的氧化还原条件。
Environ Sci Technol. 2024 Mar 19;58(11):5079-5092. doi: 10.1021/acs.est.3c07576. Epub 2024 Mar 7.
6
Prioritizing river basins for nutrient studies.优先考虑流域的营养物质研究。
Environ Monit Assess. 2024 Feb 9;196(3):248. doi: 10.1007/s10661-023-12266-7.
7
Our national nutrient reduction needs: Applying a conservation prioritization framework to US agricultural lands.我国的营养物质减排需求:将保护优先级框架应用于美国农业用地。
J Environ Manage. 2024 Feb;351:119758. doi: 10.1016/j.jenvman.2023.119758. Epub 2023 Dec 12.
8
An investigation of the seasonal relationships between meteorological factors, water quality, and sporadic cases of Legionnaires' disease in Washington, DC.对气象因素、水质与华盛顿特区散发性军团病病例之间季节性关系的调查。
Epidemiol Infect. 2023 May 15;151:e88. doi: 10.1017/S0950268823000651.
9
Predicting Potential Climate Change Impacts on Groundwater Nitrate Pollution and Risk in an Intensely Cultivated Area of South Asia.预测南亚集约化种植区气候变化对地下水硝酸盐污染及风险的潜在影响。
ACS Environ Au. 2022 Sep 1;2(6):556-576. doi: 10.1021/acsenvironau.2c00042. eCollection 2022 Nov 16.
10
Examining Relationships Between Groundwater Nitrate Concentrations in Drinking Water and Landscape Characteristics to Understand Health Risks.研究饮用水中地下水硝酸盐浓度与景观特征之间的关系以了解健康风险。
Geohealth. 2022 May 1;6(5):e2021GH000524. doi: 10.1029/2021GH000524. eCollection 2022 May.
氮素输入驱动美国夏季低流量条件下溪流和河流中的氮浓度。
Sci Total Environ. 2018 Oct 15;639:1349-1359. doi: 10.1016/j.scitotenv.2018.05.008. Epub 2018 May 26.
4
The Nitrogen Balancing Act: Tracking the Environmental Performance of Food Production.氮平衡行动:追踪食品生产的环境绩效。
Bioscience. 2018 Mar 1;68(3):194-203. doi: 10.1093/biosci/bix164. Epub 2018 Feb 7.
5
Mapping watershed integrity for the conterminous United States.绘制美国本土的流域完整性图。
Ecol Indic. 2018 Feb 1;85:1133-1148. doi: 10.1016/j.ecolind.2017.10.070.
6
National trends in drinking water quality violations.全国饮用水水质违规情况趋势。
Proc Natl Acad Sci U S A. 2018 Feb 27;115(9):2078-2083. doi: 10.1073/pnas.1719805115. Epub 2018 Feb 12.
7
Trends in Drinking Water Nitrate Violations Across the United States.美国饮用水硝酸盐违规趋势。
Environ Sci Technol. 2017 Nov 21;51(22):13450-13460. doi: 10.1021/acs.est.7b04269. Epub 2017 Nov 7.
8
Predictive mapping of the biotic condition of conterminous U.S. rivers and streams.预测美国毗邻河流和溪流的生物状况。
Ecol Appl. 2017 Dec;27(8):2397-2415. doi: 10.1002/eap.1617. Epub 2017 Nov 3.
9
Varying sensitivity of mountainous streamwater base-flow [Formula: see text]concentrations to N deposition in the northern suburbs of Tokyo.山区基流[公式:见正文]浓度对东京北郊氮沉降的敏感性变化。
Sci Rep. 2017 Aug 9;7(1):7701. doi: 10.1038/s41598-017-08111-w.
10
Assessing the accuracy and stability of variable selection methods for random forest modeling in ecology.评估生态随机森林建模中变量选择方法的准确性和稳定性。
Environ Monit Assess. 2017 Jul;189(7):316. doi: 10.1007/s10661-017-6025-0. Epub 2017 Jun 6.