Lancaster Medical School, Lancaster University, Lancaster, UK
Lancaster Medical School, Lancaster University, Lancaster, UK.
BMJ Open. 2020 Mar 23;10(3):e029624. doi: 10.1136/bmjopen-2019-029624.
This paper aims to understand spatial and temporal trends in pregabalin prescribing and the relationship with deprivation across England at both general practice and clinical commissioning group (CCG) levels.
A set of 207 independent generalised additive models are employed to model the spatiotemporal trend of pregabalin prescribed and dispensed per 1000 population, adjusting for deprivation. The response variable is pregabalin prescribed in milligrams, with weighted Index of Multiple Deprivation (IMD), geographical location and time as predictors. The set of active prescribing facilities grouped within CCG is the unit of analysis.
National Health Service open prescribing data; all general practices in England, UK between January 2015 and June 2017.
All patients registered to general practices in England, UK.
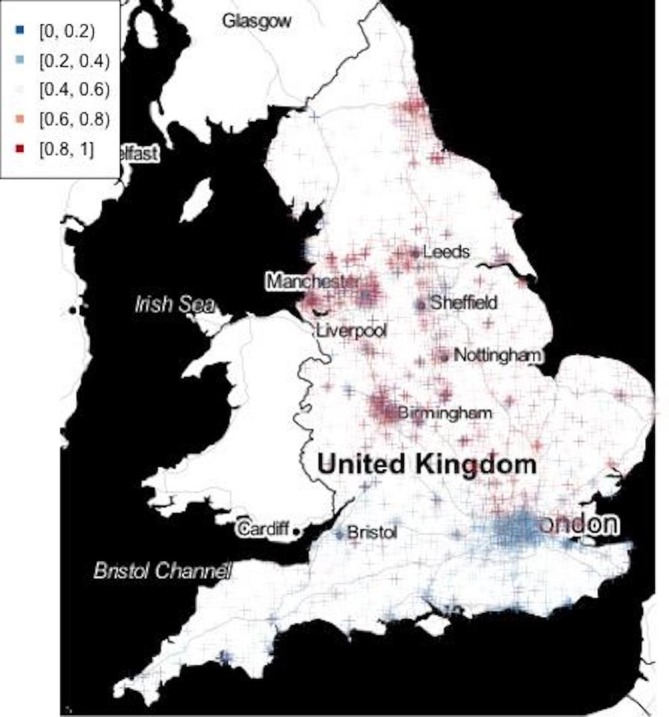
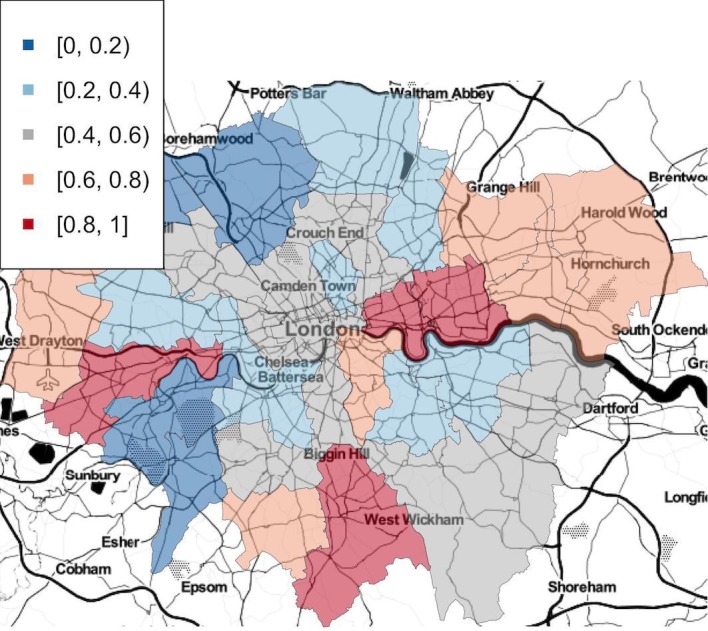
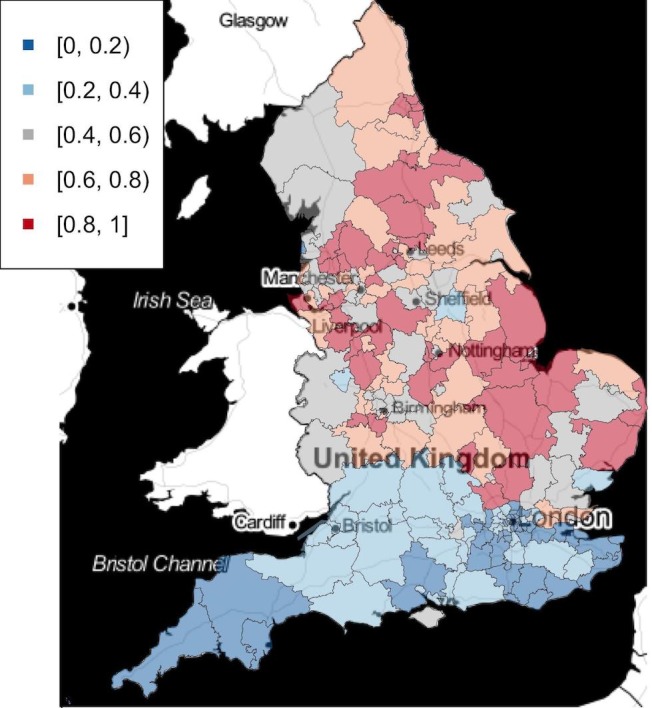
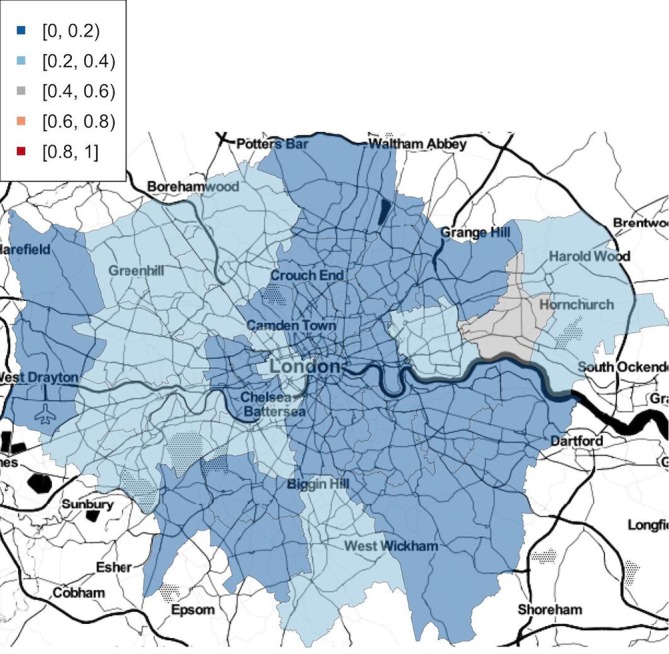
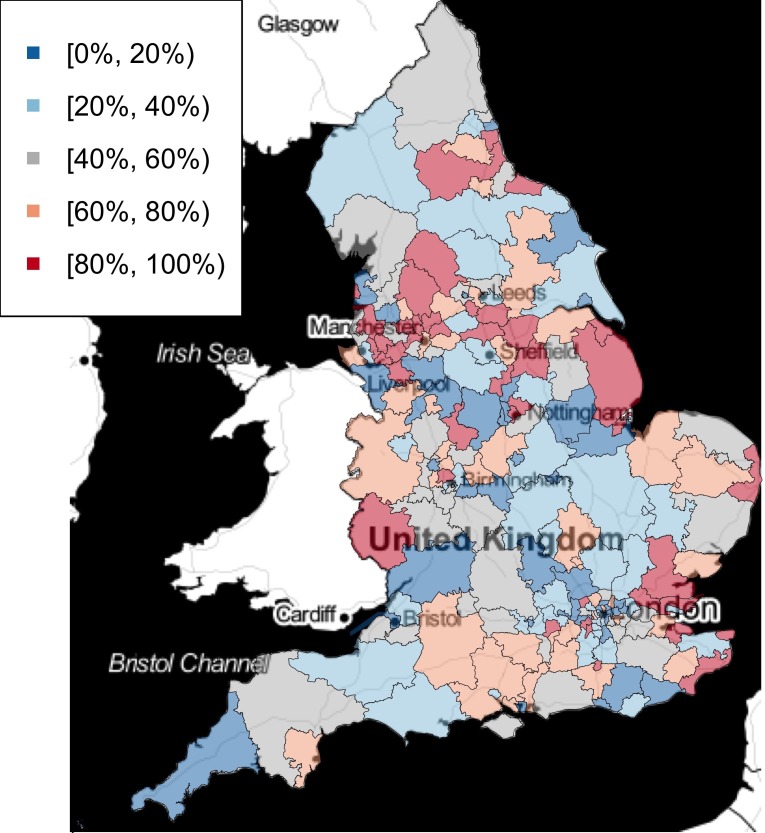
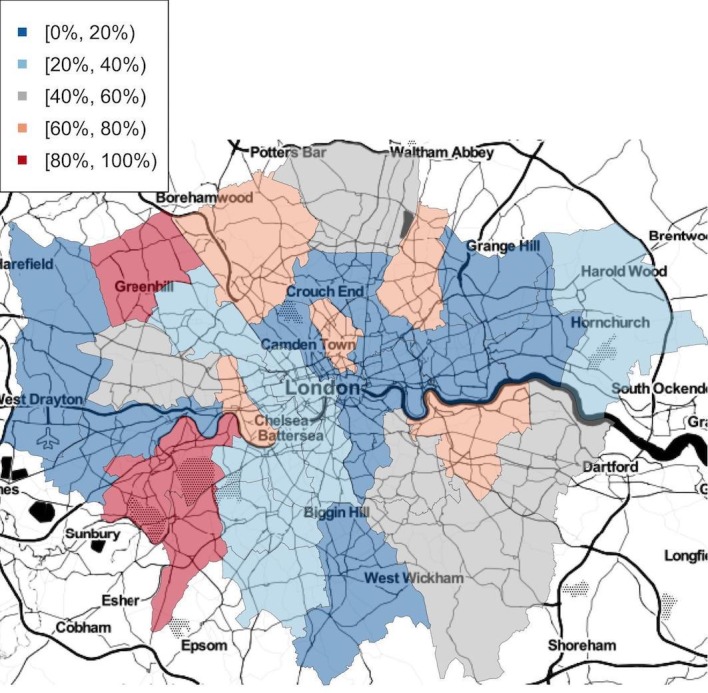
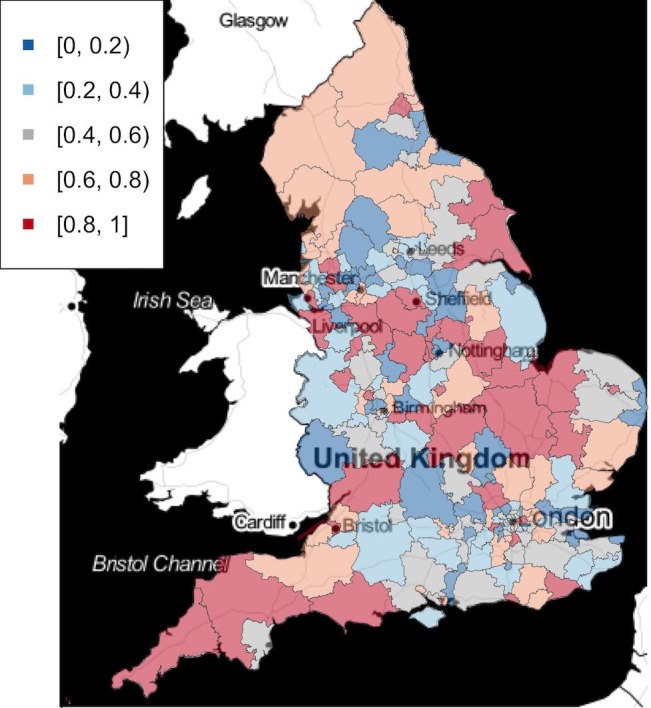
Adjusting for deprivation, a North-South divide is shown in terms of prescribing trends, with the North of England showing increasing prescribing rates during the study period on average, while in the South of England rates are on average decreasing. Approximately 60% of general practices showed increasing prescribing rate, with the highest being 4.03 (1.75 for the most decreasing). There were no apparent spatial patterns in baseline prescription rates at the CCG level. Weighted IMD score proved to be statistically significant in 138 of 207 CCGs. Two-thirds of CCGs showed more pregabalin prescribed in areas of greater deprivation. Whether the prescribing rate is high due to high baseline prescription rate or increasing rates needs to be specifically looked at.
The spatial temporal modelling demonstrated that the North of England has a significantly higher chance to see increase in pregablin prescriptions compared with the South, adjusted for weighted IMD. Weighted IMD has shown positive impact on pregabalin prescriptions for 138 CCGs.
本文旨在了解 pregabalin 处方在英格兰的时空趋势以及与贫困程度之间的关系,具体到全科医生和临床委托组(CCG)两个层面。
采用 207 个独立的广义加性模型来模拟 pregabalin 每 1000 人处方和配药的时空趋势,同时调整了贫困程度的影响。因变量是处方中的 pregabalin 毫克数,以加权的多重剥夺指数(IMD)、地理位置和时间为预测因子。分析单位是 CCG 内的一组活跃处方设施。
国家卫生服务部门的开放处方数据;2015 年 1 月至 2017 年 6 月期间英国英格兰的所有全科医生。
在英国英格兰注册的所有患者。
调整贫困程度因素后,在处方趋势方面表现出了南北差异,英格兰北部在研究期间的平均处方率呈上升趋势,而南部的平均处方率则呈下降趋势。约 60%的全科医生的处方率呈上升趋势,最高的为 4.03(下降最多的为 1.75)。在 CCG 层面,基线处方率没有明显的空间模式。加权 IMD 评分在 207 个 CCG 中有 138 个具有统计学意义。三分之二的 CCG 显示在贫困程度较高的地区处方 pregabalin 的数量更多。处方率高是由于基线处方率高还是增长率高,需要具体分析。
时空模型表明,与南部相比,英格兰北部 pregablin 处方增加的可能性明显更高,调整了加权 IMD。138 个 CCG 的加权 IMD 对 pregabalin 处方有积极影响。