• 文献检索
  • 文档翻译
  • 深度研究
  • 学术资讯
  • Suppr Zotero 插件Zotero 插件
  • 邀请有礼
  • 套餐&价格
  • 历史记录
应用&插件
Suppr Zotero 插件Zotero 插件浏览器插件Mac 客户端Windows 客户端微信小程序
定价
高级版会员购买积分包购买API积分包
服务
文献检索文档翻译深度研究API 文档MCP 服务
关于我们
关于 Suppr公司介绍联系我们用户协议隐私条款
关注我们

Suppr 超能文献

核心技术专利:CN118964589B侵权必究
粤ICP备2023148730 号-1Suppr @ 2026

文献检索

告别复杂PubMed语法,用中文像聊天一样搜索,搜遍4000万医学文献。AI智能推荐,让科研检索更轻松。

立即免费搜索

文件翻译

保留排版,准确专业,支持PDF/Word/PPT等文件格式,支持 12+语言互译。

免费翻译文档

深度研究

AI帮你快速写综述,25分钟生成高质量综述,智能提取关键信息,辅助科研写作。

立即免费体验

估计网络生态群落中的多样性。

Estimating diversity in networked ecological communities.

机构信息

Department of Biostatistics and Department of Statistics, University of Washington, Health Sciences Building, 1959 NE Pacific St, Seattle WA 98195, USA.

出版信息

Biostatistics. 2022 Jan 13;23(1):207-222. doi: 10.1093/biostatistics/kxaa015.

DOI:10.1093/biostatistics/kxaa015
PMID:32432696
原文链接:https://pmc.ncbi.nlm.nih.gov/articles/PMC8759443/
Abstract

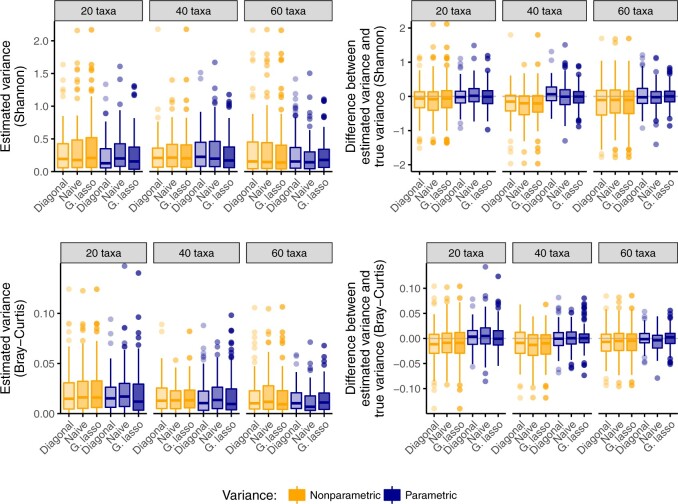
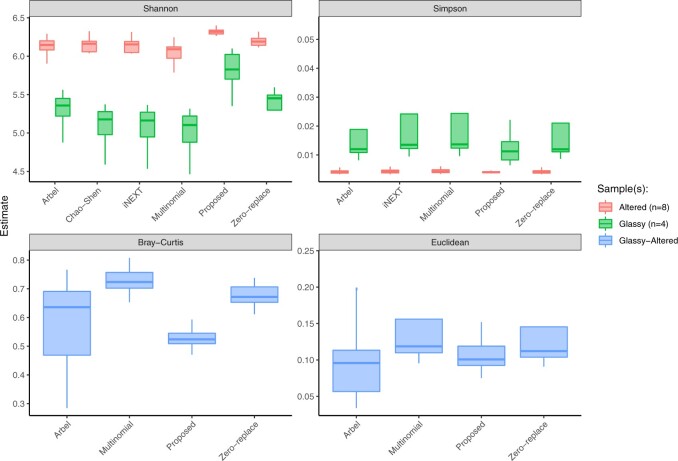
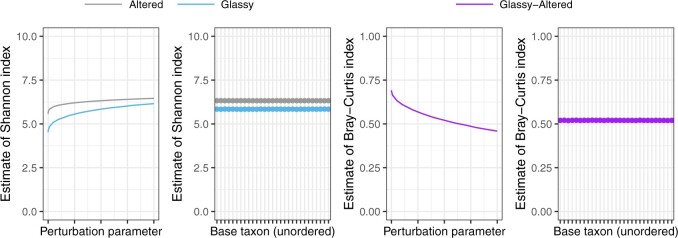
Comparing ecological communities across environmental gradients can be challenging, especially when the number of different taxonomic groups in the communities is large. In this setting, community-level summaries called diversity indices are widely used to detect changes in the community ecology. However, estimation of diversity indices has received relatively little attention from the statistical community. The most common estimates of diversity are the maximum likelihood estimates of the parameters of a multinomial model, even though the multinomial model implies strict assumptions about the sampling mechanism. In particular, the multinomial model prohibits ecological networks, where taxa positively and negatively co-occur. In this article, we leverage models from the compositional data literature that explicitly account for co-occurrence networks and use them to estimate diversity. Instead of proposing new diversity indices, we estimate popular diversity indices under these models. While the methodology is general, we illustrate the approach for the estimation of the Shannon, Simpson, Bray-Curtis, and Euclidean diversity indices. We contrast our method to multinomial, low-rank, and nonparametric methods for estimating diversity indices. Under simulation, we find that the greatest gains of the method are in strongly networked communities with many taxa. Therefore, to illustrate the method, we analyze the microbiome of seafloor basalts based on a 16S amplicon sequencing dataset with 1425 taxa and 12 communities.

摘要

比较跨环境梯度的生态群落可能具有挑战性,尤其是当群落中不同分类群的数量较大时。在这种情况下,被称为多样性指数的群落水平总结被广泛用于检测群落生态学的变化。然而,多样性指数的估计在统计学界受到的关注相对较少。最常见的多样性估计是多项模型参数的最大似然估计,即使多项模型对抽样机制有严格的假设。特别是,多项模型禁止存在正、负共现的生态网络。在本文中,我们利用成分数据文献中的模型,这些模型明确考虑了共现网络,并使用它们来估计多样性。我们没有提出新的多样性指数,而是在这些模型下估计流行的多样性指数。虽然该方法具有普遍性,但我们为 Shannon、Simpson、Bray-Curtis 和欧式多样性指数的估计说明了该方法。我们将我们的方法与多项、低秩和非参数方法进行了对比,以估计多样性指数。在模拟中,我们发现该方法在具有许多分类群的强网络社区中收益最大。因此,为了说明该方法,我们根据包含 1425 个分类群和 12 个群落的 16S 扩增子测序数据集,分析海底玄武岩的微生物组。

https://cdn.ncbi.nlm.nih.gov/pmc/blobs/86df/8759443/58c0f56acaaa/kxaa015f3.jpg
https://cdn.ncbi.nlm.nih.gov/pmc/blobs/86df/8759443/0b71d8265ca4/kxaa015f1.jpg
https://cdn.ncbi.nlm.nih.gov/pmc/blobs/86df/8759443/5a65abfb9627/kxaa015f2.jpg
https://cdn.ncbi.nlm.nih.gov/pmc/blobs/86df/8759443/58c0f56acaaa/kxaa015f3.jpg
https://cdn.ncbi.nlm.nih.gov/pmc/blobs/86df/8759443/0b71d8265ca4/kxaa015f1.jpg
https://cdn.ncbi.nlm.nih.gov/pmc/blobs/86df/8759443/5a65abfb9627/kxaa015f2.jpg
https://cdn.ncbi.nlm.nih.gov/pmc/blobs/86df/8759443/58c0f56acaaa/kxaa015f3.jpg

相似文献

1
Estimating diversity in networked ecological communities.估计网络生态群落中的多样性。
Biostatistics. 2022 Jan 13;23(1):207-222. doi: 10.1093/biostatistics/kxaa015.
2
Hill-based dissimilarity indices and null models for analysis of microbial community assembly.基于Hill 的非相似性指数和零模型用于分析微生物群落组装。
Microbiome. 2020 Sep 11;8(1):132. doi: 10.1186/s40168-020-00909-7.
3
Estimating and comparing microbial diversity in the presence of sequencing errors.在存在测序错误的情况下估计和比较微生物多样性。
PeerJ. 2016 Feb 1;4:e1634. doi: 10.7717/peerj.1634. eCollection 2016.
4
Random sampling process leads to overestimation of β-diversity of microbial communities.随机抽样过程导致微生物群落β多样性的高估。
mBio. 2013 Jun 11;4(3):e00324-13. doi: 10.1128/mBio.00324-13.
5
Taxa-function robustness in microbial communities.微生物群落中的分类功能稳健性。
Microbiome. 2018 Mar 2;6(1):45. doi: 10.1186/s40168-018-0425-4.
6
Truffle Microbiome Is Driven by Fruit Body Compartmentalization Rather than Soils Conditioned by Different Host Trees.块菌微生物组由子实体隔室化驱动,而不是由不同宿主树木条件化的土壤驱动。
mSphere. 2021 Aug 25;6(4):e0003921. doi: 10.1128/mSphere.00039-21. Epub 2021 Aug 11.
7
Conditionally rare taxa disproportionately contribute to temporal changes in microbial diversity.条件性稀有分类群对微生物多样性的时间变化贡献不成比例。
mBio. 2014 Jul 15;5(4):e01371-14. doi: 10.1128/mBio.01371-14.
8
Groundtruthing next-gen sequencing for microbial ecology-biases and errors in community structure estimates from PCR amplicon pyrosequencing.下一代测序的实地检验-从 PCR 扩增子焦磷酸测序估计微生物生态学中的偏差和误差。
PLoS One. 2012;7(9):e44224. doi: 10.1371/journal.pone.0044224. Epub 2012 Sep 6.
9
A family of interaction-adjusted indices of community similarity.一类经相互作用调整的群落相似性指数。
ISME J. 2017 Mar;11(3):791-807. doi: 10.1038/ismej.2016.139. Epub 2016 Dec 9.
10
A confidence interval analysis of sampling effort, sequencing depth, and taxonomic resolution of fungal community ecology in the era of high-throughput sequencing.高通量测序时代真菌群落生态学中采样工作量、测序深度和分类分辨率的置信区间分析
PLoS One. 2017 Dec 18;12(12):e0189796. doi: 10.1371/journal.pone.0189796. eCollection 2017.

引用本文的文献

1
PCR Bias Impacts Microbiome Ecological Analyses.聚合酶链式反应偏差影响微生物群落生态分析。
bioRxiv. 2025 Jul 31:2025.07.31.667904. doi: 10.1101/2025.07.31.667904.
2
Whole blood transcriptomics analysis of Indonesians reveals translocated and pathogenic microbiota in blood.对印度尼西亚人的全血转录组学分析揭示了血液中易位和致病的微生物群。
PLoS One. 2025 Jul 24;20(7):e0328788. doi: 10.1371/journal.pone.0328788. eCollection 2025.
3
Diet modulates the therapeutic effects of dimethyl fumarate mediated by the immunometabolic neutrophil receptor HCAR2.

本文引用的文献

1
Bayesian Nonparametric Ordination for the Analysis of Microbial Communities.用于微生物群落分析的贝叶斯非参数排序法
J Am Stat Assoc. 2017;112(520):1430-1442. doi: 10.1080/01621459.2017.1288631. Epub 2017 Feb 28.
2
Microbiome Datasets Are Compositional: And This Is Not Optional.微生物组数据集具有构成性:这并非可有可无。
Front Microbiol. 2017 Nov 15;8:2224. doi: 10.3389/fmicb.2017.02224. eCollection 2017.
3
Normalization and microbial differential abundance strategies depend upon data characteristics.归一化和微生物差异丰度策略取决于数据特征。
饮食可调节由免疫代谢中性粒细胞受体HCAR2介导的富马酸二甲酯的治疗效果。
Elife. 2025 Apr 23;14:e98970. doi: 10.7554/eLife.98970.
4
Deep learning in microbiome analysis: a comprehensive review of neural network models.微生物组分析中的深度学习:神经网络模型综述
Front Microbiol. 2025 Jan 22;15:1516667. doi: 10.3389/fmicb.2024.1516667. eCollection 2024.
5
Farm-to-fork changes in poultry microbiomes and resistomes in Maputo City, Mozambique.莫桑比克马普托市家禽微生物群和耐药基因组从农场到餐桌的变化。
mSystems. 2025 Jan 21;10(1):e0103724. doi: 10.1128/msystems.01037-24. Epub 2024 Dec 19.
6
Characterization of the Gut and Skin Microbiome over Time in Young Children with IgE-Mediated Food Allergy.儿童特应性食物过敏患儿肠道和皮肤微生物组随时间的变化特征。
Nutrients. 2024 Nov 19;16(22):3942. doi: 10.3390/nu16223942.
7
Metabarcoding reveals ecologically distinct fungal assemblages in river and groundwater along an Austrian alpine to lowland gradient.代谢条形码揭示了奥地利阿尔卑斯山到低地梯度的河流和地下水中具有生态差异的真菌组合。
FEMS Microbiol Ecol. 2024 Oct 25;100(11). doi: 10.1093/femsec/fiae139.
8
Rhizosphere Engineering of Biocontrol Agents Enriches Soil Microbial Diversity and Effectively Controls Root-Knot Nematodes.生物防治剂的根际工程丰富了土壤微生物多样性,并有效控制根结线虫。
Microb Ecol. 2024 Sep 28;87(1):120. doi: 10.1007/s00248-024-02435-7.
9
Lactobacillus-Polydopamine System for Targeted Drug Delivery in Overactive Bladder: Evidence from Bladder Cell Spheroids, Rat Models, and Urinary Microbiome Profiling.乳杆菌-聚多巴胺体系用于膀胱过度活动症的靶向药物递送:来自膀胱细胞球体、大鼠模型和尿液微生物组分析的证据。
Int J Nanomedicine. 2024 Aug 15;19:8353-8371. doi: 10.2147/IJN.S465745. eCollection 2024.
10
A cross-sectional comparison of gut metagenomes between dairy workers and community controls.奶牛场工人和社区对照人群肠道宏基因组的横断面比较。
BMC Genomics. 2024 Jul 20;25(1):708. doi: 10.1186/s12864-024-10562-1.
Microbiome. 2017 Mar 3;5(1):27. doi: 10.1186/s40168-017-0237-y.
4
Bioconductor Workflow for Microbiome Data Analysis: from raw reads to community analyses.微生物组数据分析的Bioconductor工作流程:从原始读段到群落分析
F1000Res. 2016 Jun 24;5:1492. doi: 10.12688/f1000research.8986.2. eCollection 2016.
5
Microbial Communities on Seafloor Basalts at Dorado Outcrop Reflect Level of Alteration and Highlight Global Lithic Clades.多拉多露头海底玄武岩上的微生物群落反映了蚀变程度并突出了全球岩石类群。
Front Microbiol. 2015 Dec 23;6:1470. doi: 10.3389/fmicb.2015.01470. eCollection 2015.
6
Sparse and compositionally robust inference of microbial ecological networks.微生物生态网络的稀疏且成分稳健推断
PLoS Comput Biol. 2015 May 7;11(5):e1004226. doi: 10.1371/journal.pcbi.1004226. eCollection 2015 May.
7
Stability Approach to Regularization Selection (StARS) for High Dimensional Graphical Models.高维图形模型的正则化选择稳定性方法(StARS)
Adv Neural Inf Process Syst. 2010 Dec 31;24(2):1432-1440.
8
Identifying keystone species in the human gut microbiome from metagenomic timeseries using sparse linear regression.使用稀疏线性回归从宏基因组时间序列中识别人类肠道微生物组中的关键物种。
PLoS One. 2014 Jul 23;9(7):e102451. doi: 10.1371/journal.pone.0102451. eCollection 2014.
9
A logistic normal multinomial regression model for microbiome compositional data analysis.用于微生物组组成数据分析的逻辑正态多项回归模型。
Biometrics. 2013 Dec;69(4):1053-63. doi: 10.1111/biom.12079. Epub 2013 Oct 15.
10
Abundance-weighted phylogenetic diversity measures distinguish microbial community states and are robust to sampling depth.丰度加权系统发育多样性测度可区分微生物群落状态,且对采样深度具有稳健性。
PeerJ. 2013 Sep 12;1:e157. doi: 10.7717/peerj.157. eCollection 2013.