• 文献检索
  • 文档翻译
  • 深度研究
  • 学术资讯
  • Suppr Zotero 插件Zotero 插件
  • 邀请有礼
  • 套餐&价格
  • 历史记录
应用&插件
Suppr Zotero 插件Zotero 插件浏览器插件Mac 客户端Windows 客户端微信小程序
定价
高级版会员购买积分包购买API积分包
服务
文献检索文档翻译深度研究API 文档MCP 服务
关于我们
关于 Suppr公司介绍联系我们用户协议隐私条款
关注我们

Suppr 超能文献

核心技术专利:CN118964589B侵权必究
粤ICP备2023148730 号-1Suppr @ 2026

文献检索

告别复杂PubMed语法,用中文像聊天一样搜索,搜遍4000万医学文献。AI智能推荐,让科研检索更轻松。

立即免费搜索

文件翻译

保留排版,准确专业,支持PDF/Word/PPT等文件格式,支持 12+语言互译。

免费翻译文档

深度研究

AI帮你快速写综述,25分钟生成高质量综述,智能提取关键信息,辅助科研写作。

立即免费体验

快速衡量 COVID-19 医疗资源的空间可达性:以美国伊利诺伊州为例。

Rapidly measuring spatial accessibility of COVID-19 healthcare resources: a case study of Illinois, USA.

机构信息

CyberGIS Center for Advanced Digital and Spatial Studies, University of Illinois at Urbana-Champaign, Urbana, IL, USA.

Department of Geography and Geographic Information Science, University of Illinois at Urbana-Champaign, Urbana, IL, USA.

出版信息

Int J Health Geogr. 2020 Sep 14;19(1):36. doi: 10.1186/s12942-020-00229-x.

DOI:10.1186/s12942-020-00229-x
PMID:32928236
原文链接:https://pmc.ncbi.nlm.nih.gov/articles/PMC7487451/
Abstract

BACKGROUND

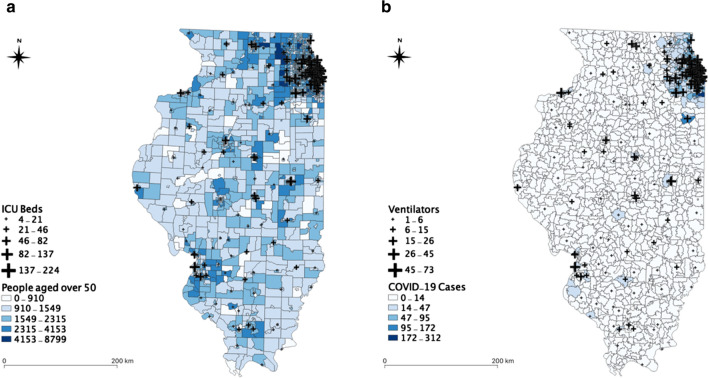
The severe acute respiratory syndrome coronavirus 2 (SARS-CoV-2), causing the coronavirus disease 2019 (COVID-19) pandemic, has infected millions of people and caused hundreds of thousands of deaths. While COVID-19 has overwhelmed healthcare resources (e.g., healthcare personnel, testing resources, hospital beds, and ventilators) in a number of countries, limited research has been conducted to understand spatial accessibility of such resources. This study fills this gap by rapidly measuring the spatial accessibility of COVID-19 healthcare resources with a particular focus on Illinois, USA.

METHOD

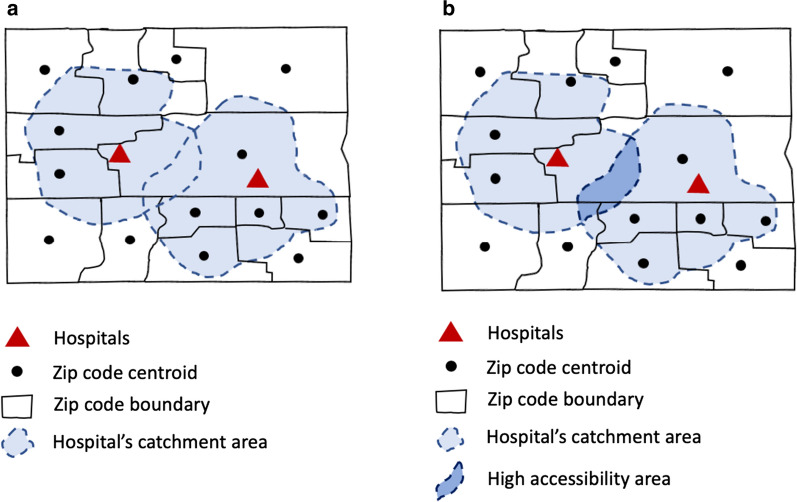
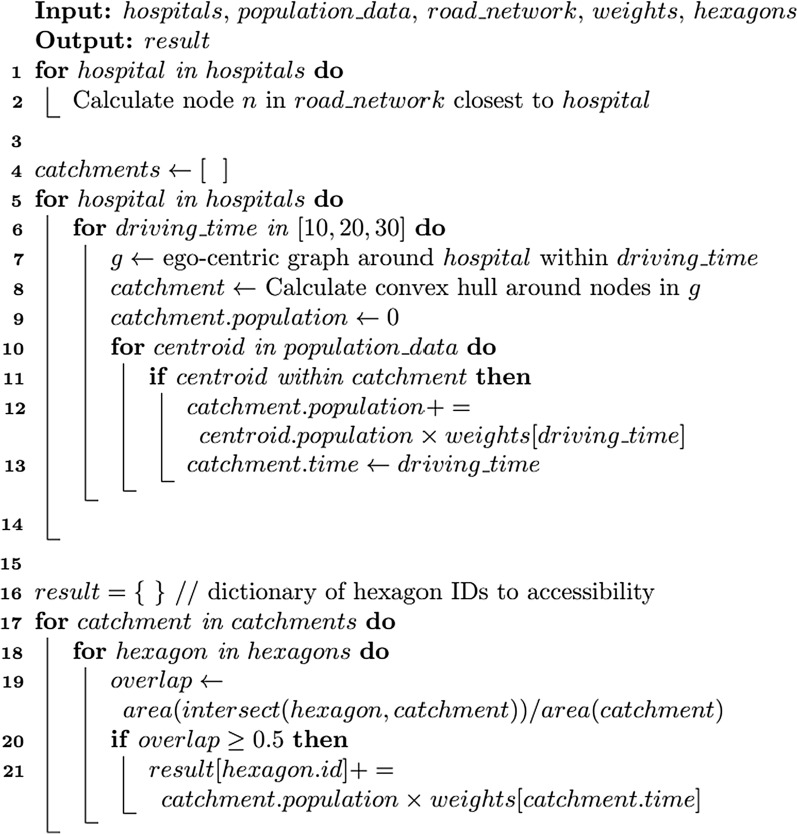
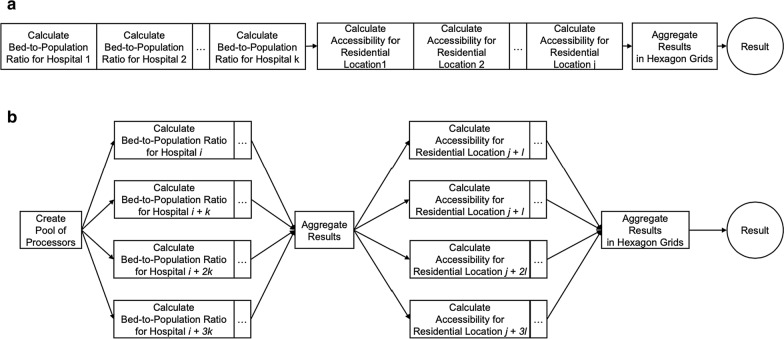
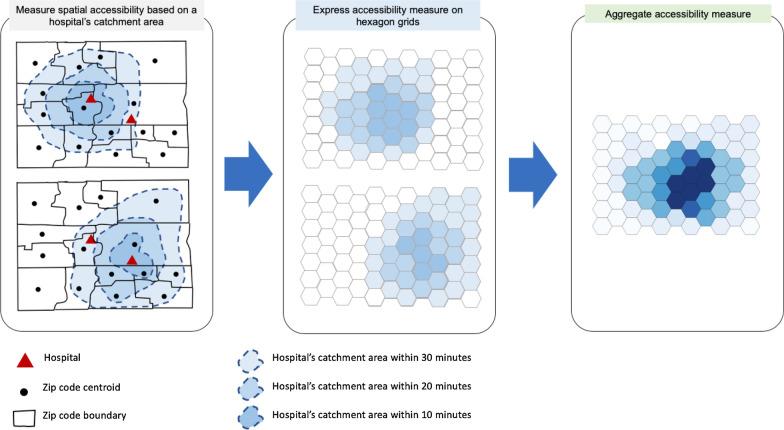
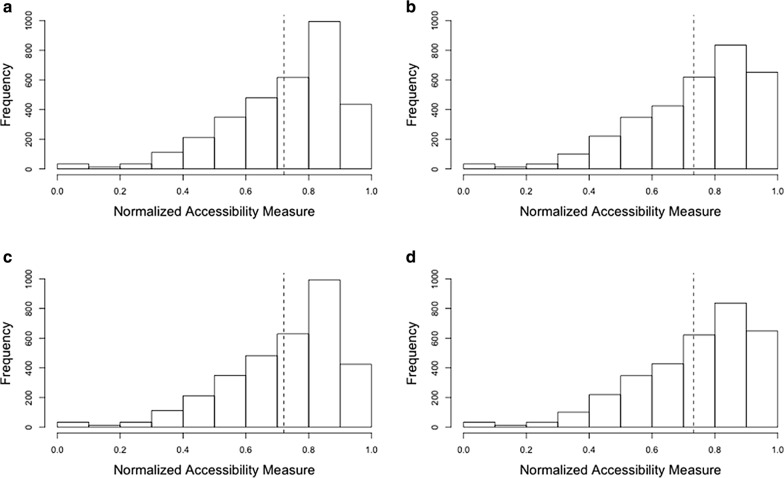
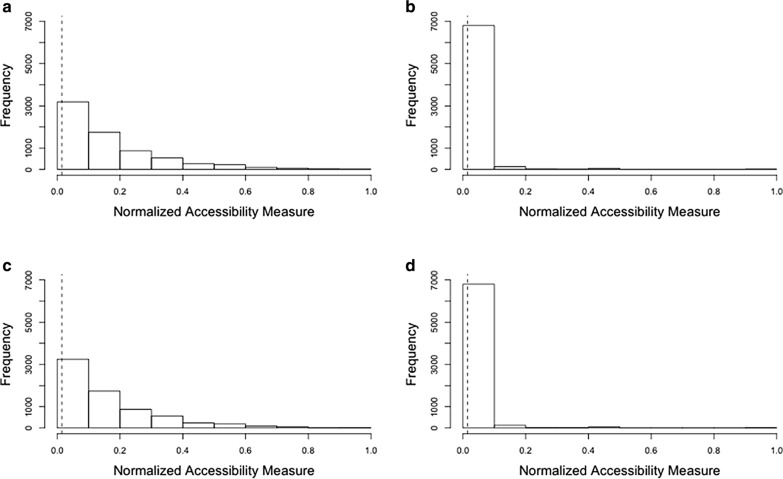
The rapid measurement is achieved by resolving computational intensity of an enhanced two-step floating catchment area (E2SFCA) method through a parallel computing strategy based on cyberGIS (cyber geographic information science and systems). The E2SFCA has two major steps. First, it calculates a bed-to-population ratio for each hospital location. Second, it sums these ratios for residential locations where hospital locations overlap.

RESULTS

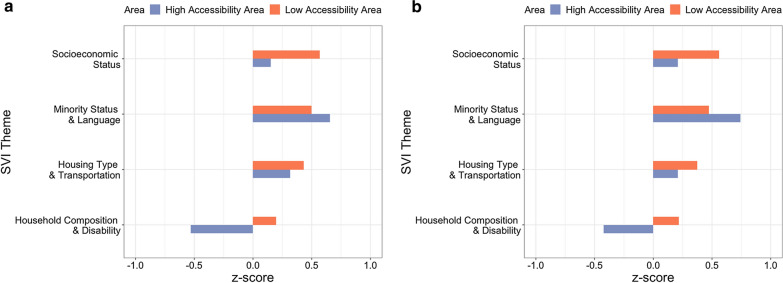
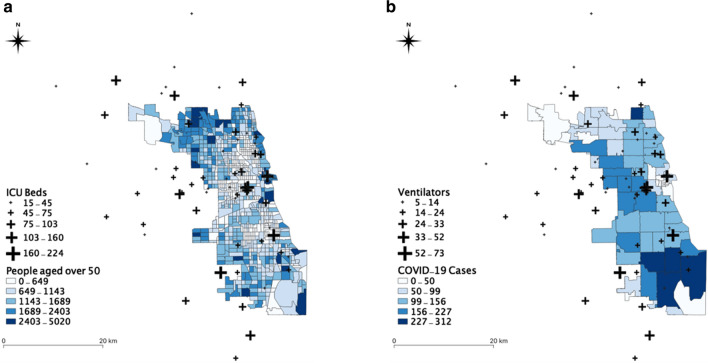
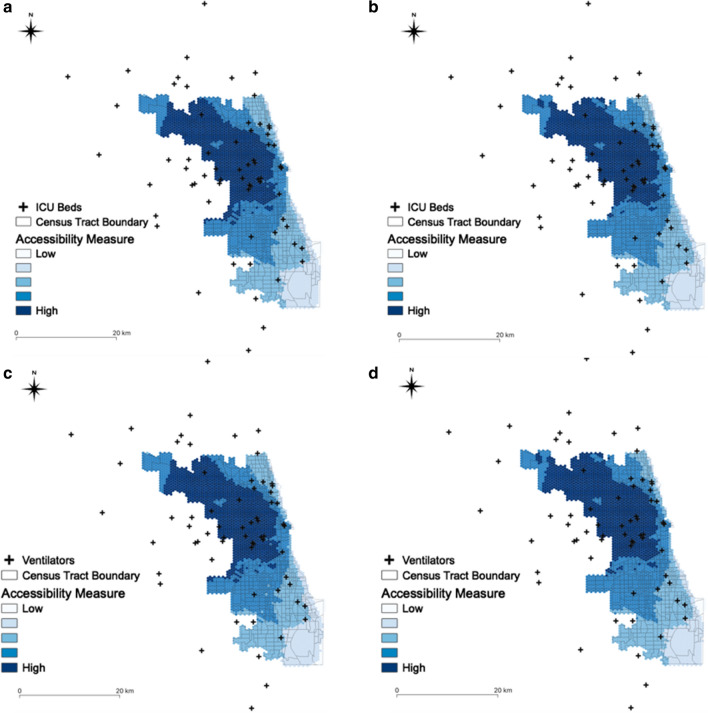
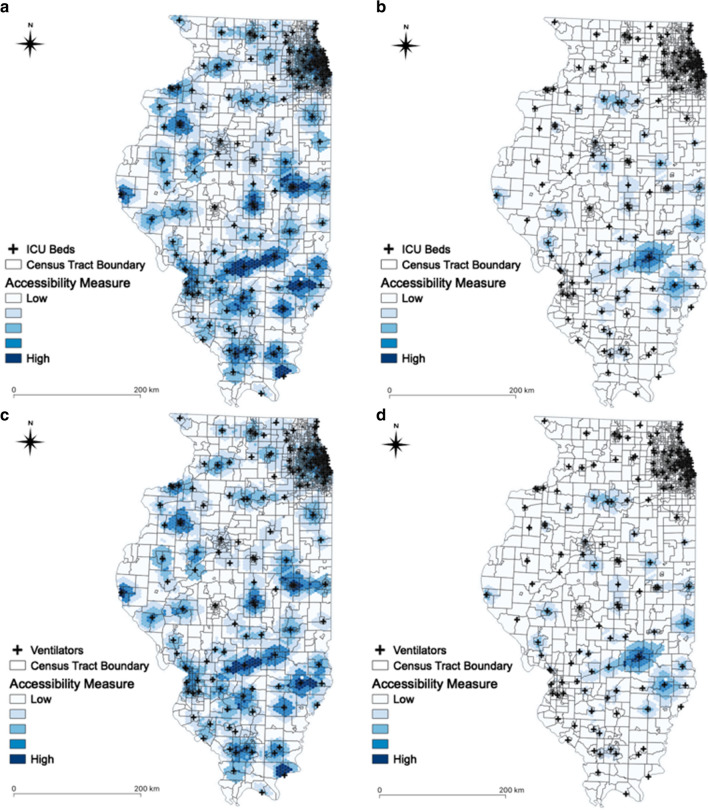
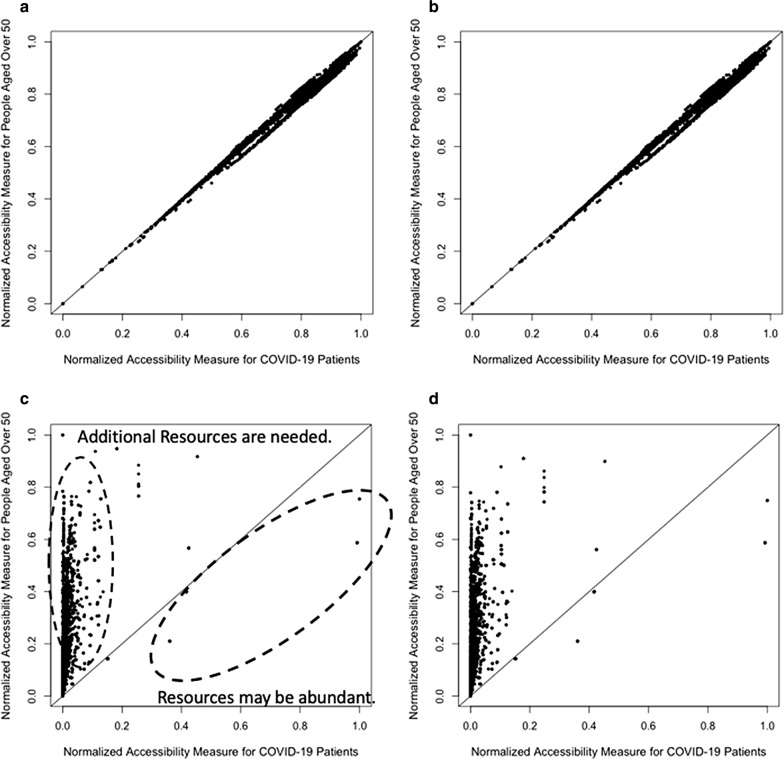
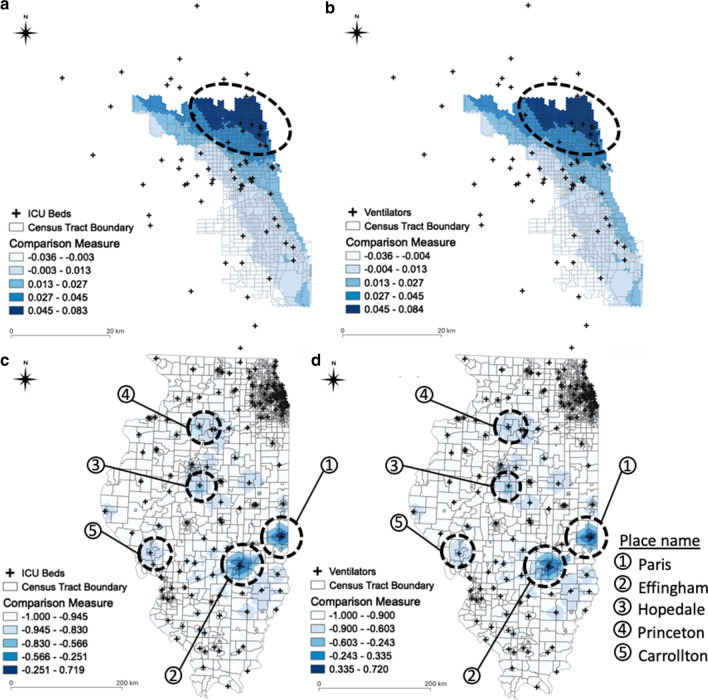
The comparison of the spatial accessibility measures for COVID-19 patients to those of population at risk identifies which geographic areas need additional healthcare resources to improve access. The results also help delineate the areas that may face a COVID-19-induced shortage of healthcare resources. The Chicagoland, particularly the southern Chicago, shows an additional need for resources. This study also identified vulnerable population residing in the areas with low spatial accessibility in Chicago.

CONCLUSION

Rapidly measuring spatial accessibility of healthcare resources provides an improved understanding of how well the healthcare infrastructure is equipped to save people's lives during the COVID-19 pandemic. The findings are relevant for policymakers and public health practitioners to allocate existing healthcare resources or distribute new resources for maximum access to health services.

摘要

背景

导致 2019 年冠状病毒病(COVID-19)大流行的严重急性呼吸综合征冠状病毒 2(SARS-CoV-2)已经感染了数百万人,并导致数十万人死亡。虽然 COVID-19 已经使许多国家的医疗资源(例如医护人员、检测资源、病床和呼吸机)不堪重负,但对于了解这些资源的空间可达性的研究却很有限。本研究通过快速测量 COVID-19 医疗资源的空间可达性来填补这一空白,重点关注美国伊利诺伊州。

方法

通过基于网络地理信息科学和系统(cyberGIS)的并行计算策略来解决增强两步浮动集水区域(E2SFCA)方法的计算强度,从而实现快速测量。E2SFCA 有两个主要步骤。首先,它为每个医院位置计算床位与人口的比例。其次,它对医院位置重叠的居民点的这些比例进行求和。

结果

将 COVID-19 患者的空间可达性指标与高危人群的空间可达性指标进行比较,可以确定哪些地理区域需要额外的医疗资源来改善可达性。结果还有助于划定可能面临 COVID-19 导致医疗资源短缺的区域。芝加哥大都市区,特别是南部的芝加哥,需要额外的资源。本研究还确定了居住在芝加哥空间可达性低的地区的弱势人群。

结论

快速测量医疗资源的空间可达性可提高对医疗基础设施在 COVID-19 大流行期间挽救生命的能力的理解。研究结果与政策制定者和公共卫生从业者相关,可用于分配现有医疗资源或分发新资源,以实现对卫生服务的最大利用。

https://cdn.ncbi.nlm.nih.gov/pmc/blobs/56a3/7489020/4a058e9a015b/12942_2020_229_Fig13_HTML.jpg
https://cdn.ncbi.nlm.nih.gov/pmc/blobs/56a3/7489020/a3b676634124/12942_2020_229_Fig1_HTML.jpg
https://cdn.ncbi.nlm.nih.gov/pmc/blobs/56a3/7489020/86dd826707c6/12942_2020_229_Fig2_HTML.jpg
https://cdn.ncbi.nlm.nih.gov/pmc/blobs/56a3/7489020/b09698fdff39/12942_2020_229_Fig3_HTML.jpg
https://cdn.ncbi.nlm.nih.gov/pmc/blobs/56a3/7489020/8d9e997767ea/12942_2020_229_Fig4_HTML.jpg
https://cdn.ncbi.nlm.nih.gov/pmc/blobs/56a3/7489020/85e7f83a13e9/12942_2020_229_Fig5_HTML.jpg
https://cdn.ncbi.nlm.nih.gov/pmc/blobs/56a3/7489020/6ac1fe6fccad/12942_2020_229_Fig6_HTML.jpg
https://cdn.ncbi.nlm.nih.gov/pmc/blobs/56a3/7489020/8475943062e4/12942_2020_229_Fig7_HTML.jpg
https://cdn.ncbi.nlm.nih.gov/pmc/blobs/56a3/7489020/f5fbf09b653e/12942_2020_229_Fig8_HTML.jpg
https://cdn.ncbi.nlm.nih.gov/pmc/blobs/56a3/7489020/98c1d8df168b/12942_2020_229_Fig9_HTML.jpg
https://cdn.ncbi.nlm.nih.gov/pmc/blobs/56a3/7489020/12af2b91a445/12942_2020_229_Fig10_HTML.jpg
https://cdn.ncbi.nlm.nih.gov/pmc/blobs/56a3/7489020/0395411cd654/12942_2020_229_Fig11_HTML.jpg
https://cdn.ncbi.nlm.nih.gov/pmc/blobs/56a3/7489020/77c9fbfea604/12942_2020_229_Fig12_HTML.jpg
https://cdn.ncbi.nlm.nih.gov/pmc/blobs/56a3/7489020/4a058e9a015b/12942_2020_229_Fig13_HTML.jpg

相似文献

1
Rapidly measuring spatial accessibility of COVID-19 healthcare resources: a case study of Illinois, USA.快速衡量 COVID-19 医疗资源的空间可达性:以美国伊利诺伊州为例。
Int J Health Geogr. 2020 Sep 14;19(1):36. doi: 10.1186/s12942-020-00229-x.
2
Estimating the Maximum Capacity of COVID-19 Cases Manageable per Day Given a Health Care System's Constrained Resources.在医疗系统资源受限的情况下估算每日可管理的新冠病例最大数量。
Ann Intern Med. 2020 Sep 1;173(5):407-410. doi: 10.7326/M20-1169. Epub 2020 Apr 16.
3
Unequable spatial accessibility to hospitals in developing megacities: New evidence from Beijing.发展中特大城市的医院空间可达性不均衡:来自北京的新证据。
Health Place. 2020 Sep;65:102406. doi: 10.1016/j.healthplace.2020.102406. Epub 2020 Aug 30.
4
Access to intensive care in 14 European countries: a spatial analysis of intensive care need and capacity in the light of COVID-19.14 个欧洲国家的重症监护病房资源获取情况:基于 COVID-19 分析重症监护需求和能力的空间分析。
Intensive Care Med. 2020 Nov;46(11):2026-2034. doi: 10.1007/s00134-020-06229-6. Epub 2020 Sep 4.
5
A flexible method for optimising sharing of healthcare resources and demand in the context of the COVID-19 pandemic.一种灵活的方法,用于优化 COVID-19 大流行背景下的医疗资源和需求共享。
PLoS One. 2020 Oct 21;15(10):e0241027. doi: 10.1371/journal.pone.0241027. eCollection 2020.
6
[Bed capacity management in times of the COVID-19 pandemic : A simulation-based prognosis of normal and intensive care beds using the descriptive data of the University Hospital Augsburg].[新冠疫情期间的床位容量管理:利用奥格斯堡大学医院的描述性数据对普通病房和重症监护病房床位进行基于模拟的预测]
Anaesthesist. 2020 Oct;69(10):717-725. doi: 10.1007/s00101-020-00830-6. Epub 2020 Aug 21.
7
The Urge to Build More Intensive Care Unit Beds and Ventilators: Intuitive but Errant.增设重症监护病房床位和呼吸机的冲动:直观但错误。
Ann Intern Med. 2020 Aug 18;173(4):302-303. doi: 10.7326/M20-2071. Epub 2020 May 7.
8
Assessing the hospital surge capacity of the Kenyan health system in the face of the COVID-19 pandemic.评估肯尼亚卫生系统在面对 COVID-19 大流行时的医院增量能力。
PLoS One. 2020 Jul 20;15(7):e0236308. doi: 10.1371/journal.pone.0236308. eCollection 2020.
9
Concerns for low-resource countries, with under-prepared intensive care units, facing the COVID-19 pandemic.对于资源匮乏国家而言,其重症监护病房准备不足,正面临着新冠疫情,令人担忧。
Infect Dis Health. 2020 Nov;25(4):227-232. doi: 10.1016/j.idh.2020.05.008. Epub 2020 Jun 5.
10
Estimation of COVID-19-induced depletion of hospital resources in Ontario, Canada.加拿大安大略省因 COVID-19 导致的医院资源消耗估计。
CMAJ. 2020 Jun 15;192(24):E640-E646. doi: 10.1503/cmaj.200715. Epub 2020 May 14.

引用本文的文献

1
Extreme geographic misalignment of healthcare resources and HIV treatment deserts in Malawi.马拉维医疗资源的极度地理分布不均与艾滋病毒治疗荒漠
Nat Med. 2025 May;31(5):1474-1483. doi: 10.1038/s41591-025-03561-6. Epub 2025 Mar 14.
2
Challenges and opportunities of artificial intelligence in African health space.人工智能在非洲卫生领域的挑战与机遇
Digit Health. 2025 Jan 21;11:20552076241305915. doi: 10.1177/20552076241305915. eCollection 2025 Jan-Dec.
3
Equity analysis of bus network balance from the perspective of spatial morphology and service capability.

本文引用的文献

1
A cyberGIS approach to spatiotemporally explicit uncertainty and global sensitivity analysis for agent-based modeling of vector-borne disease transmission.一种用于基于主体的媒介传播疾病传播建模的时空明确不确定性和全局敏感性分析的网络地理信息系统方法。
Ann Am Assoc Geogr. 2020;110(6):1855-1873. doi: 10.1080/24694452.2020.1723400. Epub 2020 Mar 20.
2
Measures of Spatial Accessibility to Healthcare in a GIS Environment: Synthesis and a Case Study in Chicago Region.地理信息系统环境下医疗保健空间可达性的度量:综述与芝加哥地区的案例研究
Environ Plann B Plann Des. 2003 Dec;30(6):865-884. doi: 10.1068/b29120.
3
Measuring Community Vulnerability to Natural and Anthropogenic Hazards: The Centers for Disease Control and Prevention's Social Vulnerability Index.
基于空间形态与服务能力视角的公交网络均衡性分析
Sci Rep. 2025 Jan 17;15(1):2339. doi: 10.1038/s41598-025-86318-y.
4
Spatial Allocation Rationality Analysis of Medical Resources Based on Multi-Source Data: Case Study of Taiyuan, China.基于多源数据的医疗资源空间配置合理性分析:以中国太原为例
Healthcare (Basel). 2024 Aug 21;12(16):1669. doi: 10.3390/healthcare12161669.
5
Assessing the Disruption Impact on Healthcare Delivery.评估医疗服务提供中断的影响。
J Prim Care Community Health. 2024 Jan-Dec;15:21501319241260351. doi: 10.1177/21501319241260351.
6
Enhancing pooling levels strengthens the risk resilience of healthcare insurance: a case study of basic medical insurance fund operations data in Gansu, China.提高统筹层次增强医疗保险风险抵御能力:以中国甘肃省基本医疗保险基金运行数据为例
BMC Public Health. 2024 Apr 23;24(1):1129. doi: 10.1186/s12889-024-18558-y.
7
Spatial accessibility modeling to healthcare facilities in the case of health shocks of Midnapore municipality, India.印度米德纳布尔市卫生冲击情况下医疗设施的空间可达性建模
GeoJournal. 2023 Feb 11:1-24. doi: 10.1007/s10708-023-10838-1.
8
Spatial analysis of COVID-19 incidence and its determinants using spatial modeling: A study on India.使用空间建模对COVID-19发病率及其决定因素进行空间分析:印度的一项研究。
Environ Chall (Amst). 2021 Aug;4:100096. doi: 10.1016/j.envc.2021.100096. Epub 2021 Apr 10.
9
Spatial Accessibility to Primary Care in Metropolitan France: Results Using the SCALE Spatial Accessibility Index for All Regions.法国大都市的初级保健空间可达性:使用所有地区的 SCALE 空间可达性指数的结果。
Int J Environ Res Public Health. 2024 Feb 28;21(3):276. doi: 10.3390/ijerph21030276.
10
Hide Your Distance: Privacy Risks and Protection in Spatial Accessibility Analysis.隐藏你的距离:空间可达性分析中的隐私风险与保护
Proc ACM SIGSPATIAL Int Conf Adv Inf. 2023 Nov;2023. doi: 10.1145/3589132.3625656. Epub 2023 Dec 22.
衡量社区对自然和人为灾害的脆弱性:疾病控制与预防中心的社会脆弱性指数
J Environ Health. 2018 Jun;80(10):34-36.
4
Risk factors for disease severity, unimprovement, and mortality in COVID-19 patients in Wuhan, China.中国武汉 COVID-19 患者疾病严重程度、无改善和死亡率的危险因素。
Clin Microbiol Infect. 2020 Jun;26(6):767-772. doi: 10.1016/j.cmi.2020.04.012. Epub 2020 Apr 15.
5
Rapid surveillance of COVID-19 in the United States using a prospective space-time scan statistic: Detecting and evaluating emerging clusters.使用前瞻性时空扫描统计方法对美国新冠病毒病进行快速监测:检测和评估新出现的聚集性疫情。
Appl Geogr. 2020 May;118:102202. doi: 10.1016/j.apgeog.2020.102202. Epub 2020 Apr 8.
6
Which Melbourne Metropolitan Areas Are Vulnerable to COVID-19 Based on Age, Disability, and Access to Health Services? Using Spatial Analysis to Identify Service Gaps and Inform Delivery.基于年龄、残疾和获得卫生服务的情况,哪些墨尔本都会区容易受到 COVID-19 的影响?利用空间分析来发现服务差距并为服务提供提供信息。
J Pain Symptom Manage. 2020 Jul;60(1):e41-e44. doi: 10.1016/j.jpainsymman.2020.03.041. Epub 2020 Apr 8.
7
A Framework for Rationing Ventilators and Critical Care Beds During the COVID-19 Pandemic.新冠疫情期间呼吸机及重症监护床位分配框架
JAMA. 2020 May 12;323(18):1773-1774. doi: 10.1001/jama.2020.5046.
8
Planning and provision of ECMO services for severe ARDS during the COVID-19 pandemic and other outbreaks of emerging infectious diseases.COVID-19 大流行期间和其他新发传染病疫情中严重急性呼吸窘迫综合征的体外膜肺氧合服务规划和供应。
Lancet Respir Med. 2020 May;8(5):518-526. doi: 10.1016/S2213-2600(20)30121-1. Epub 2020 Mar 20.
9
Covid-19 mass testing facilities could end the epidemic rapidly.新冠病毒大规模检测设施能够迅速终结疫情。
BMJ. 2020 Mar 22;368:m1163. doi: 10.1136/bmj.m1163.
10
Critical Care Utilization for the COVID-19 Outbreak in Lombardy, Italy: Early Experience and Forecast During an Emergency Response.意大利伦巴第大区新冠疫情期间的重症监护利用情况:应急响应中的早期经验与预测
JAMA. 2020 Apr 28;323(16):1545-1546. doi: 10.1001/jama.2020.4031.