• 文献检索
  • 文档翻译
  • 深度研究
  • 学术资讯
  • Suppr Zotero 插件Zotero 插件
  • 邀请有礼
  • 套餐&价格
  • 历史记录
应用&插件
Suppr Zotero 插件Zotero 插件浏览器插件Mac 客户端Windows 客户端微信小程序
定价
高级版会员购买积分包购买API积分包
服务
文献检索文档翻译深度研究API 文档MCP 服务
关于我们
关于 Suppr公司介绍联系我们用户协议隐私条款
关注我们

Suppr 超能文献

核心技术专利:CN118964589B侵权必究
粤ICP备2023148730 号-1Suppr @ 2026

文献检索

告别复杂PubMed语法,用中文像聊天一样搜索,搜遍4000万医学文献。AI智能推荐,让科研检索更轻松。

立即免费搜索

文件翻译

保留排版,准确专业,支持PDF/Word/PPT等文件格式,支持 12+语言互译。

免费翻译文档

深度研究

AI帮你快速写综述,25分钟生成高质量综述,智能提取关键信息,辅助科研写作。

立即免费体验

按死因和年龄组划分的死亡变化如何导致了近期苏格兰预期寿命增长的停滞?2000 - 2002年至2015 - 2017年死亡率数据的比较分解分析。

How have changes in death by cause and age group contributed to the recent stalling of life expectancy gains in Scotland? Comparative decomposition analysis of mortality data, 2000-2002 to 2015-2017.

作者信息

Ramsay Julie, Minton Jon, Fischbacher Colin, Fenton Lynda, Kaye-Bardgett Maria, Wyper Grant M A, Richardson Elizabeth, McCartney Gerry

机构信息

Vital Events Statistics, National Records of Scotland, Edinburgh, UK

Place and Wellbeing Directorate, Public Health Scotland, Glasgow, UK.

出版信息

BMJ Open. 2020 Oct 7;10(10):e036529. doi: 10.1136/bmjopen-2019-036529.

DOI:10.1136/bmjopen-2019-036529
PMID:33033012
原文链接:https://pmc.ncbi.nlm.nih.gov/articles/PMC7542937/
Abstract

OBJECTIVE

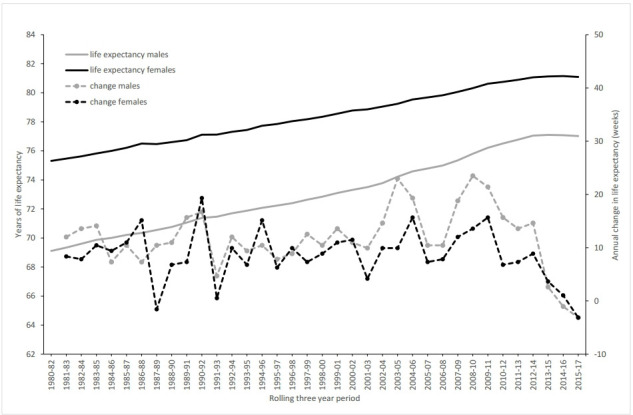
Annual gains in life expectancy in Scotland were slower in recent years than in the previous two decades. This analysis investigates how deaths in different age groups and from different causes have contributed to annual average change in life expectancy across two time periods: 2000-2002 to 2012-2014 and 2012-2014 to 2015-2017.

SETTING

Scotland.

METHODS

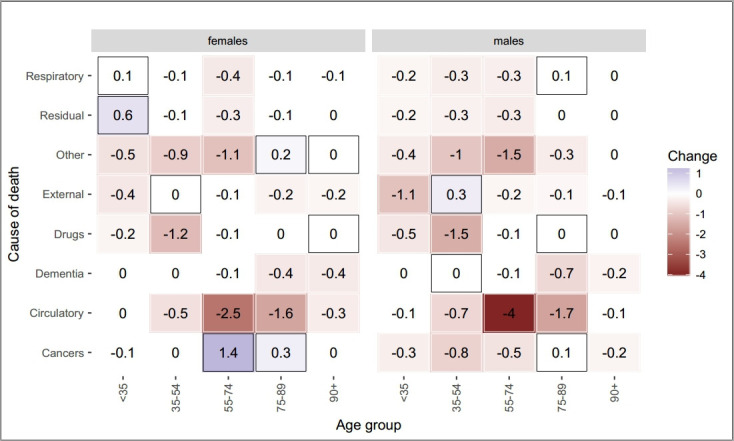
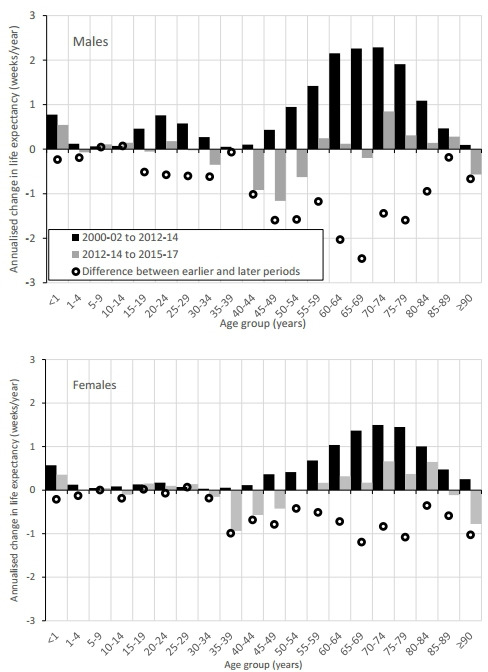
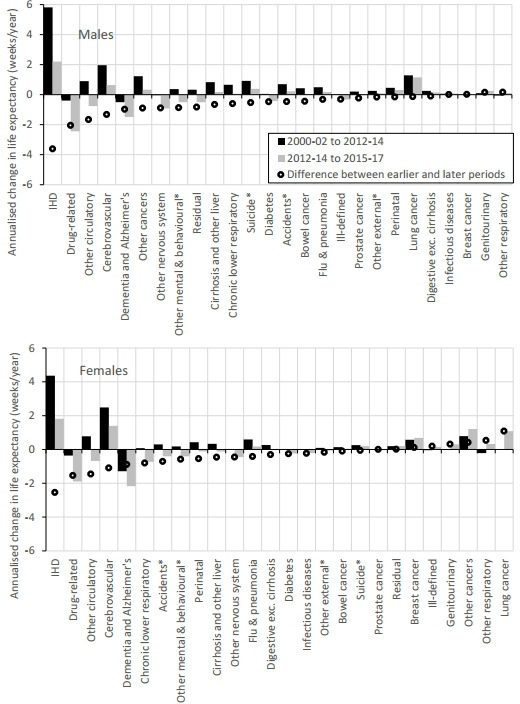
Life expectancy at birth was calculated from death and population counts, disaggregated by 5 year age group and by underlying cause of death. Arriaga's method of life expectancy decomposition was applied to produce estimates of the contribution of different age groups and underlying causes to changes in life expectancy at birth for the two periods.

RESULTS

Annualised gains in life expectancy between 2012-2014 and 2015-2017 were markedly smaller than in the earlier period. Almost all age groups saw worsening mortality trends, which deteriorated for most cause of death groups between 2012-2014 and 2015-2017. In particular, the previously observed substantial life expectancy gains due to reductions in mortality from circulatory causes, which most benefited those aged 55-84 years, more than halved. Mortality rates for those aged 30-54 years and 90+ years worsened, due in large part to increases in drug-related deaths, and dementia and Alzheimer's disease, respectively.

CONCLUSION

Future research should seek to explain the changes in mortality trends for all age groups and causes. More investigation is required to establish to what extent shortcomings in the social security system and public services may be contributing to the adverse trends and preventing mitigation of the impact of other contributing factors, such as influenza outbreaks.

摘要

目的

近年来,苏格兰预期寿命的年增长速度比前二十年有所放缓。本分析调查了不同年龄组和不同原因导致的死亡如何促成了两个时间段(2000 - 2002年至2012 - 2014年以及2012 - 2014年至2015 - 2017年)预期寿命的年平均变化。

背景

苏格兰。

方法

根据死亡人数和人口计数计算出生时的预期寿命,并按5岁年龄组和潜在死因进行分类。应用阿瑞亚加的预期寿命分解方法来估计不同年龄组和潜在原因对这两个时期出生时预期寿命变化的贡献。

结果

2012 - 2014年至2015 - 2017年期间预期寿命的年化增长明显低于早期。几乎所有年龄组的死亡率趋势都在恶化,在2012 - 2014年至2015 - 2017年期间,大多数死因组的情况都有所恶化。特别是,此前观察到的由于循环系统疾病死亡率下降而带来的显著预期寿命增长(这对55 - 84岁的人群益处最大)减少了一半以上。30 - 54岁和90岁以上人群的死亡率恶化,主要分别归因于与药物相关的死亡增加以及痴呆症和阿尔茨海默病。

结论

未来的研究应致力于解释所有年龄组和死因的死亡率趋势变化。需要进行更多调查,以确定社会保障系统和公共服务的缺陷在多大程度上可能导致了这些不利趋势,并阻碍了对其他促成因素(如流感爆发)影响的缓解。

https://cdn.ncbi.nlm.nih.gov/pmc/blobs/a2f1/7542937/e388b447522d/bmjopen-2019-036529f05.jpg
https://cdn.ncbi.nlm.nih.gov/pmc/blobs/a2f1/7542937/552a0da47b71/bmjopen-2019-036529f01.jpg
https://cdn.ncbi.nlm.nih.gov/pmc/blobs/a2f1/7542937/89682ccd5822/bmjopen-2019-036529f02.jpg
https://cdn.ncbi.nlm.nih.gov/pmc/blobs/a2f1/7542937/c32dcb7860a5/bmjopen-2019-036529f03.jpg
https://cdn.ncbi.nlm.nih.gov/pmc/blobs/a2f1/7542937/aa63c12a2060/bmjopen-2019-036529f04.jpg
https://cdn.ncbi.nlm.nih.gov/pmc/blobs/a2f1/7542937/e388b447522d/bmjopen-2019-036529f05.jpg

相似文献

1
How have changes in death by cause and age group contributed to the recent stalling of life expectancy gains in Scotland? Comparative decomposition analysis of mortality data, 2000-2002 to 2015-2017.按死因和年龄组划分的死亡变化如何导致了近期苏格兰预期寿命增长的停滞?2000 - 2002年至2015 - 2017年死亡率数据的比较分解分析。
BMJ Open. 2020 Oct 7;10(10):e036529. doi: 10.1136/bmjopen-2019-036529.
2
Global, regional, and national under-5 mortality, adult mortality, age-specific mortality, and life expectancy, 1970-2016: a systematic analysis for the Global Burden of Disease Study 2016.全球、区域和国家 5 岁以下儿童死亡率、成人死亡率、特定年龄死亡率和预期寿命,1970-2016 年:2016 年全球疾病负担研究的系统分析。
Lancet. 2017 Sep 16;390(10100):1084-1150. doi: 10.1016/S0140-6736(17)31833-0.
3
All-cause and cause-specific mortality in Scotland 1981-2011 by age, sex and deprivation: a population-based study.苏格兰 1981-2011 年按年龄、性别和贫困程度划分的全因和特定原因死亡率:一项基于人群的研究。
Eur J Public Health. 2019 Aug 1;29(4):647-655. doi: 10.1093/eurpub/ckz010.
4
Changing mortality patterns in East and West Germany and Poland. II: short-term trends during transition and in the 1990s.东德、西德和波兰死亡率模式的变化。II:转型期间及20世纪90年代的短期趋势。
J Epidemiol Community Health. 2000 Dec;54(12):899-906. doi: 10.1136/jech.54.12.899.
5
Alternative projections of mortality and disability by cause 1990-2020: Global Burden of Disease Study.1990 - 2020年按病因划分的死亡率和残疾率的替代预测:全球疾病负担研究
Lancet. 1997 May 24;349(9064):1498-504. doi: 10.1016/S0140-6736(96)07492-2.
6
Mortality inequality in populations with equal life expectancy: Arriaga's decomposition method in SAS, Stata, and Excel.预期寿命相等的人群中的死亡率不平等:SAS、Stata和Excel中的阿里亚加分解法。
Ann Epidemiol. 2014 Aug;24(8):575-80, 580.e1. doi: 10.1016/j.annepidem.2014.05.006. Epub 2014 May 27.
7
Forecasting life expectancy, years of life lost, and all-cause and cause-specific mortality for 250 causes of death: reference and alternative scenarios for 2016-40 for 195 countries and territories.预测 250 种死因的预期寿命、损失的生命年数以及全因和特定死因死亡率:2016-2040 年 195 个国家和地区的参考和替代情景。
Lancet. 2018 Nov 10;392(10159):2052-2090. doi: 10.1016/S0140-6736(18)31694-5. Epub 2018 Oct 16.
8
Understanding the rapid increase in life expectancy in South Korea.理解韩国预期寿命快速增长的原因。
Am J Public Health. 2010 May;100(5):896-903. doi: 10.2105/AJPH.2009.160341. Epub 2010 Mar 18.
9
Avoidable, amenable, and preventable mortalities in South Korea, 2000-2017: Age-period-cohort trends and impact on life expectancy at birth.2000-2017 年韩国可避免、可归因和可预防的死亡:年龄-时期-队列趋势及其对出生时预期寿命的影响。
Soc Sci Med. 2019 Sep;237:112482. doi: 10.1016/j.socscimed.2019.112482. Epub 2019 Aug 7.
10
CDC National Health Report: leading causes of morbidity and mortality and associated behavioral risk and protective factors--United States, 2005-2013.美国疾病控制与预防中心国家健康报告:2005 - 2013年美国发病和死亡的主要原因以及相关行为风险和保护因素
MMWR Suppl. 2014 Oct 31;63(4):3-27.

引用本文的文献

1
Understanding changes to life expectancy and inequalities in the UK, Germany, and other high-income countries.了解英国、德国及其他高收入国家预期寿命和不平等现象的变化。
Bundesgesundheitsblatt Gesundheitsforschung Gesundheitsschutz. 2025 Sep 9. doi: 10.1007/s00103-025-04126-1.
2
Prepandemic inequalities in the burden of disease in Scotland due to multiple deprivation: a retrospective study.苏格兰因多重贫困导致的疾病负担在疫情前的不平等:一项回顾性研究。
BMJ Public Health. 2023 Dec 1;1(1):e000191. doi: 10.1136/bmjph-2023-000191. eCollection 2023 Nov.
3
A new era of inequality: profound changes to mortality in England, Scotland, and 10 major British cities.

本文引用的文献

1
Recent adverse mortality trends in Scotland: comparison with other high-income countries.苏格兰近期的不良死亡率趋势:与其他高收入国家的比较。
BMJ Open. 2019 Oct 31;9(10):e029936. doi: 10.1136/bmjopen-2019-029936.
2
Socioeconomic inequality in recent adverse all-cause mortality trends in Scotland.苏格兰近期全因不良死亡率趋势中的社会经济不平等现象。
J Epidemiol Community Health. 2019 Oct;73(10):971-974. doi: 10.1136/jech-2019-212300. Epub 2019 Jul 20.
3
Changes in health in the countries of the UK and 150 English Local Authority areas 1990-2016: a systematic analysis for the Global Burden of Disease Study 2016.
不平等的新时代:英格兰、苏格兰及英国10个主要城市死亡率的深刻变化。
Eur J Public Health. 2025 Apr 1;35(2):235-241. doi: 10.1093/eurpub/ckaf008.
4
Younger but sicker? Cohort trends in disease accumulation among middle-aged and older adults in Scotland using health-linked data from the Scottish Longitudinal Study.更年轻但病更多?利用苏格兰纵向研究中的健康关联数据,对苏格兰中年及老年人群疾病累积情况的队列趋势研究
Eur J Public Health. 2024 Aug 1;34(4):696-703. doi: 10.1093/eurpub/ckae062.
5
Influenza: cause or excuse? An analysis of flu's influence on worsening mortality trends in England and Wales, 2010-19.流感:病因还是借口?对 2010-19 年英格兰和威尔士死亡率趋势恶化中流感影响的分析。
Br Med Bull. 2024 Mar 13;149(1):72-89. doi: 10.1093/bmb/ldad028.
6
Social security cuts and life expectancy: a longitudinal analysis of local authorities in England, Scotland and Wales.社会保障削减与预期寿命:对英格兰、苏格兰和威尔士地方当局的纵向分析
J Epidemiol Community Health. 2023 Nov 7;78(2):82-7. doi: 10.1136/jech-2023-220328.
7
Trends in psychological distress in Great Britain, 1991-2019: evidence from three representative surveys.英国 1991-2019 年心理困扰趋势:三项代表性调查的证据。
J Epidemiol Community Health. 2023 Jul;77(7):468-473. doi: 10.1136/jech-2022-219660. Epub 2023 May 15.
8
How much of the stalled mortality trends in Scotland and England can be attributed to obesity?苏格兰和英格兰死亡率趋势停滞不前的原因有多少可以归因于肥胖?
BMJ Open. 2022 Dec 14;12(12):e067310. doi: 10.1136/bmjopen-2022-067310.
9
Bearing the burden of austerity: how do changing mortality rates in the UK compare between men and women?承受紧缩之重:英国男女死亡率变化如何对比?
J Epidemiol Community Health. 2022 Dec;76(12):1027-1033. doi: 10.1136/jech-2022-219645. Epub 2022 Oct 4.
10
Trends in the diversity of mortality causes and age-standardised mortality rates among subpopulations within Scotland, 2001-2019.2001 - 2019年苏格兰各亚人群死亡率原因多样性及年龄标准化死亡率趋势。
SSM Popul Health. 2022 Aug 13;19:101192. doi: 10.1016/j.ssmph.2022.101192. eCollection 2022 Sep.
1990-2016 年英国和 150 个英格兰地方行政区的健康变化:2016 年全球疾病负担研究的系统分析。
Lancet. 2018 Nov 3;392(10158):1647-1661. doi: 10.1016/S0140-6736(18)32207-4. Epub 2018 Oct 24.
4
Contributions of diseases and injuries to widening life expectancy inequalities in England from 2001 to 2016: a population-based analysis of vital registration data.2001 年至 2016 年期间,英格兰因疾病和伤害导致的预期寿命不平等差距扩大的贡献:基于人口的生命登记数据分析。
Lancet Public Health. 2018 Dec;3(12):e586-e597. doi: 10.1016/S2468-2667(18)30214-7. Epub 2018 Nov 23.
5
Evaluating effects of recent changes in NHS resource allocation policy on inequalities in amenable mortality in England, 2007-2014: time-series analysis.评价 2007-2014 年英国国民保健服务资源分配政策变化对可避免死亡率不平等的影响:时间序列分析。
J Epidemiol Community Health. 2019 Feb;73(2):162-167. doi: 10.1136/jech-2018-211141. Epub 2018 Nov 23.
6
Stalling life expectancy in the UK.英国预期寿命停滞不前。
BMJ. 2018 Sep 27;362:k4050. doi: 10.1136/bmj.k4050.
7
Recent trends in life expectancy across high income countries: retrospective observational study.高收入国家预期寿命的近期趋势:回顾性观察研究。
BMJ. 2018 Aug 15;362:k2562. doi: 10.1136/bmj.k2562.
8
Rise in mortality-when will the government take note?死亡率上升——政府何时才会注意到?
BMJ. 2018 Jun 25;361:k2747. doi: 10.1136/bmj.k2747.
9
A Cause-of-Death Decomposition of Young Adult Excess Mortality.青年超额死亡率的死因分解。
Demography. 2018 Jun;55(3):957-978. doi: 10.1007/s13524-018-0680-9.
10
Significant spike in excess mortality in England in winter 2014/15 - influenza the likely culprit.2014/15 年冬季英格兰超额死亡率显著上升——流感可能是罪魁祸首。
Epidemiol Infect. 2018 Jul;146(9):1106-1113. doi: 10.1017/S0950268818001152. Epub 2018 May 10.