Department of Computer Science, University of North Carolina at Chapel Hill, USA.
Department of Family Medicine, Preventive Medicine Residency Program, University of North Carolina School of Medicine, USA.
J Am Med Inform Assoc. 2020 Dec 9;27(12):1943-1948. doi: 10.1093/jamia/ocaa146.
To create an online visualization to support fatality management in North Carolina.
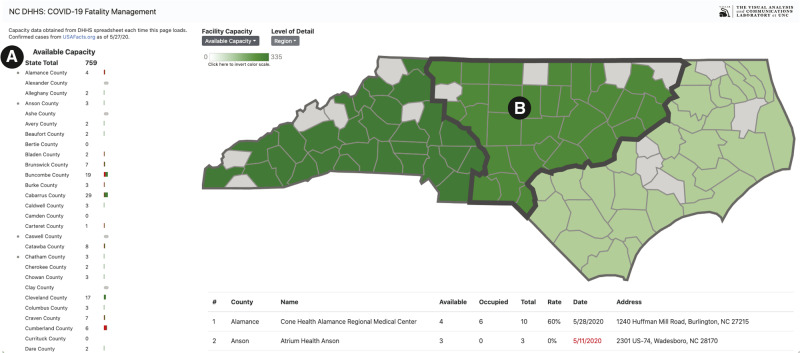
A web application aggregates online datasets for coronavirus disease 2019 (COVID-19) infection rates and morgue utilization. The data are visualized through an interactive, online dashboard.
The web application was shared with state and local public health officials across North Carolina. Users could adjust interactive maps and other statistical charts to view live reports of metrics at multiple aggregation levels (eg, county or region). The application also provides access to detailed tabular data for individual facilities.
Stakeholders found this tool helpful for providing situational awareness of capacity, hotspots, and utilization fluctuations. Timely reporting of facility and county data were key, and future work can help streamline the data collection process. There is potential to generalize the technology to other use cases.
This dashboard facilitates fatality management by visualizing county and regional aggregate statistics in North Carolina.
创建一个在线可视化工具,以支持北卡罗来纳州的死亡管理。
一个网络应用程序聚合了冠状病毒病 2019(COVID-19)感染率和太平间使用情况的在线数据集。通过一个交互式在线仪表板对数据进行可视化。
该网络应用程序与北卡罗来纳州的州和地方公共卫生官员共享。用户可以调整交互式地图和其他统计图表,以查看多个聚合级别(例如县或地区)的实时指标报告。该应用程序还提供了对个别设施详细表格数据的访问。
利益相关者发现该工具有助于了解能力、热点和利用波动的情况。及时报告设施和县的数据是关键,未来的工作可以帮助简化数据收集过程。该技术有可能推广到其他用例。
该仪表板通过可视化北卡罗来纳州的县和地区汇总统计数据,促进了死亡管理。