Senathirajah Yalini, Kaufman David R, Cato Kenrick D, Borycki Elizabeth M, Fawcett Jaime Allen, Kushniruk Andre W
Department of Biomedical Informatics, School of Medicine, University of Pittsburgh, Pittsburgh, PA, United States.
Medical Informatics Program, School of Health Professions, State University of New York - Downstate Health Sciences University, Brooklyn, NY, United States.
JMIR Hum Factors. 2020 Oct 21;7(4):e18484. doi: 10.2196/18484.
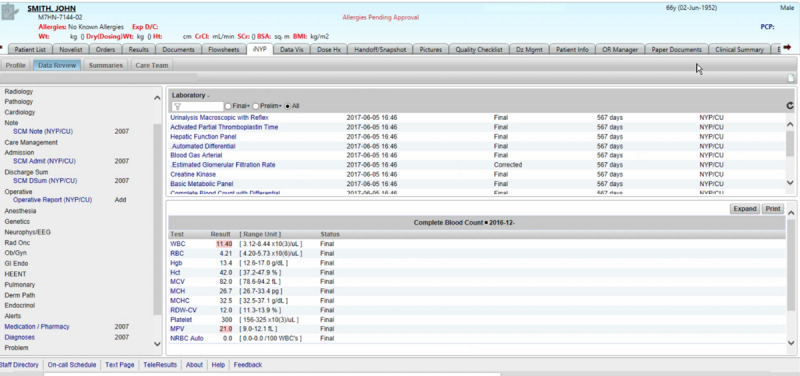
The complexity of health care data and workflow presents challenges to the study of usability in electronic health records (EHRs). Display fragmentation refers to the distribution of relevant data across different screens or otherwise far apart, requiring complex navigation for the user's workflow. Task and information fragmentation also contribute to cognitive burden.
This study aims to define and analyze some of the main sources of fragmentation in EHR user interfaces (UIs); discuss relevant theoretical, historical, and practical considerations; and use granular microanalytic methods and visualization techniques to help us understand the nature of fragmentation and opportunities for EHR optimization or redesign.
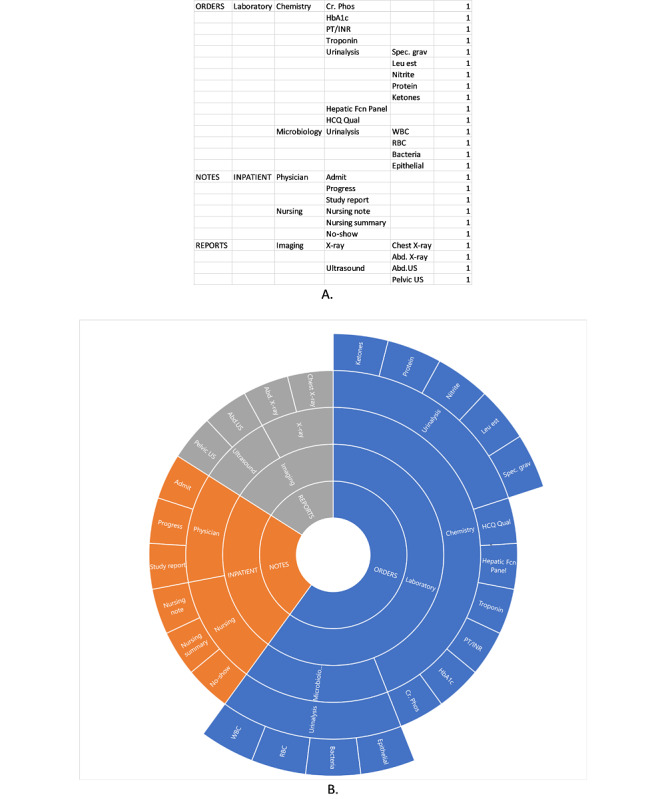
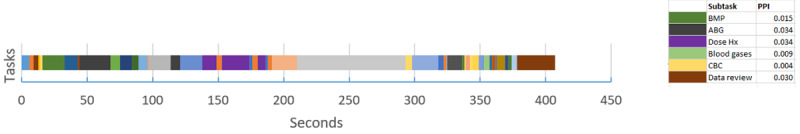
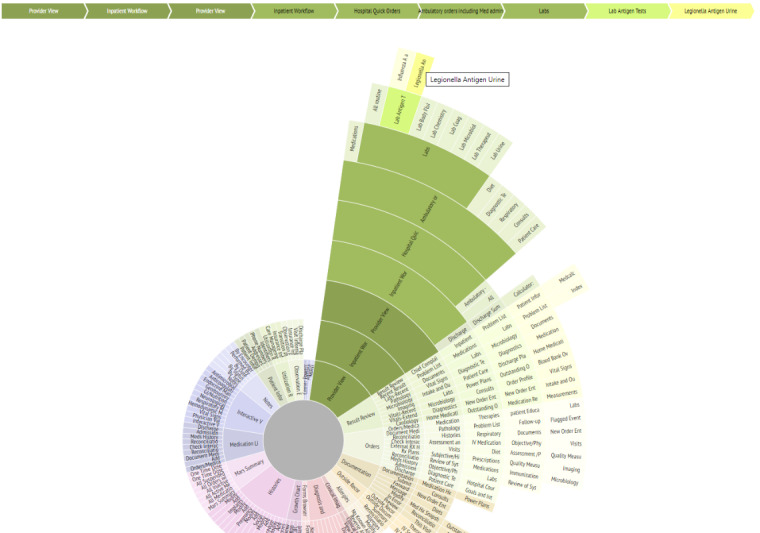
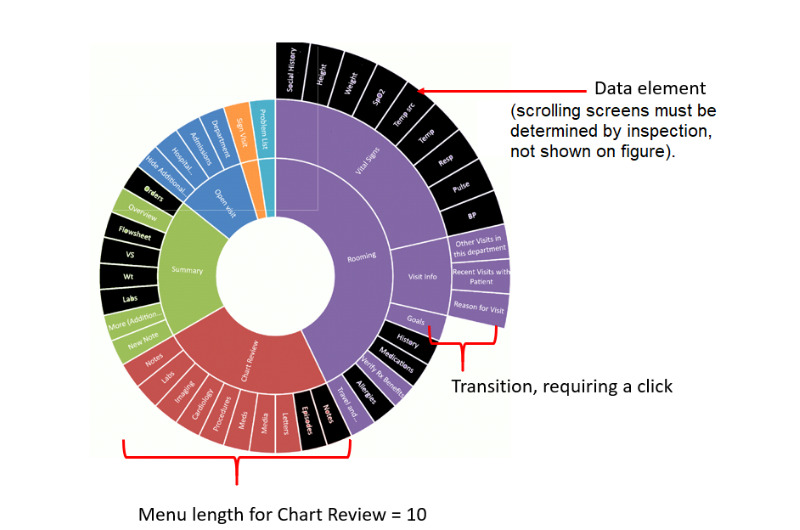
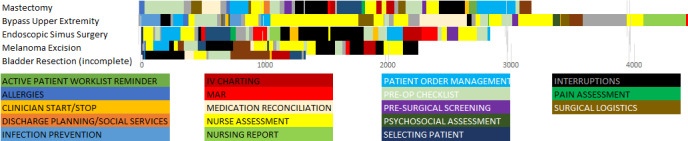
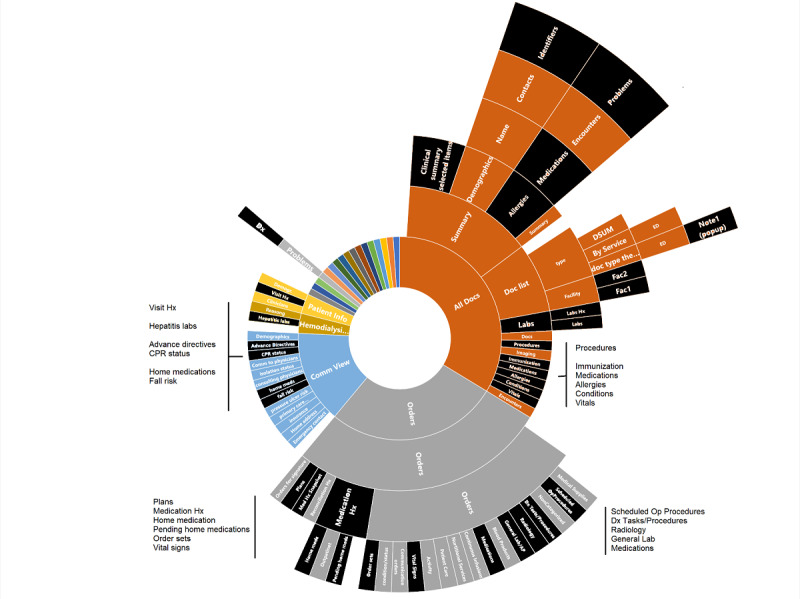
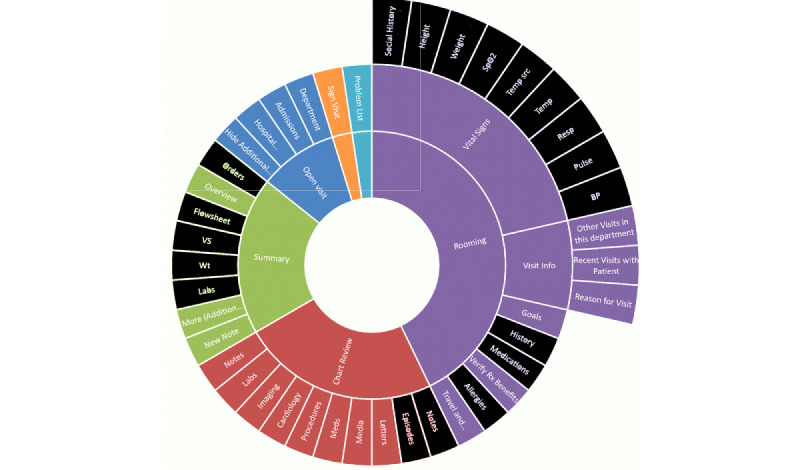
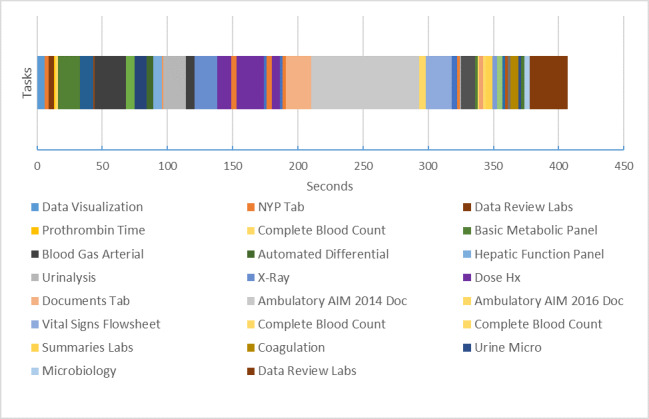
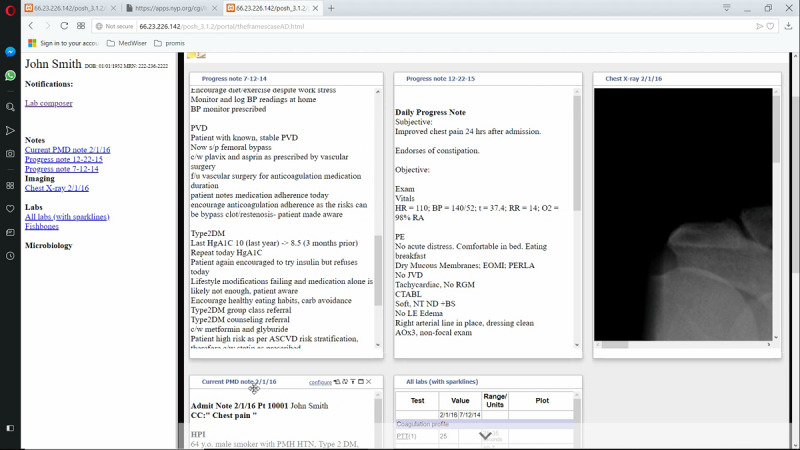
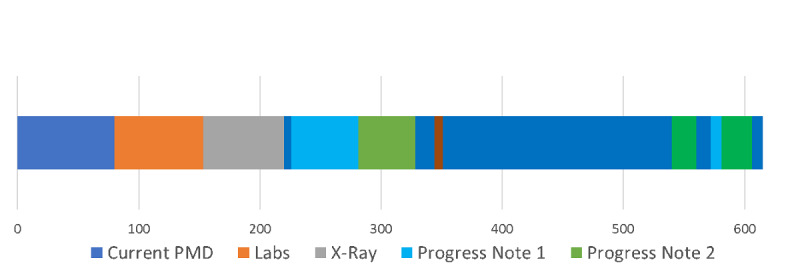
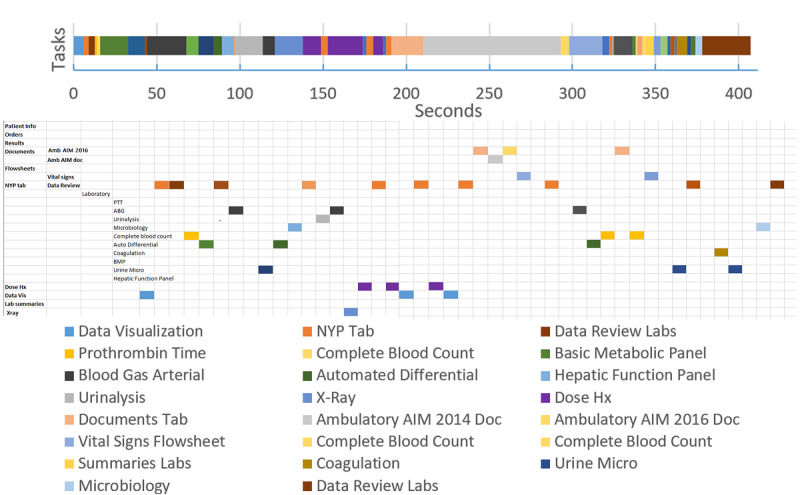
Sunburst visualizations capture the EHR navigation structure, showing levels and sublevels of the navigation tree, allowing calculation of a new measure, the Display Fragmentation Index. Time belt visualizations present the sequences of subtasks and allow calculation of proportion per instance, a measure that quantifies task fragmentation. These measures can be used separately or in conjunction to compare EHRs as well as tasks and subtasks in workflows and identify opportunities for reductions in steps and fragmentation. We present an example use of the methods for comparison of 2 different EHR interfaces (commercial and composable) in which subjects apprehend the same patient case.
Screen transitions were substantially reduced for the composable interface (from 43 to 14), whereas clicks (including scrolling) remained similar.
These methods can aid in our understanding of UI needs under complex conditions and tasks to optimize EHR workflows and redesign.
医疗保健数据和工作流程的复杂性给电子健康记录(EHR)的可用性研究带来了挑战。显示碎片化是指相关数据分散在不同屏幕上或位置相隔甚远,这要求用户在工作流程中进行复杂的导航操作。任务和信息碎片化也会增加认知负担。
本研究旨在定义和分析EHR用户界面(UI)中碎片化的一些主要来源;讨论相关的理论、历史和实际考量;并使用精细的微观分析方法和可视化技术来帮助我们理解碎片化的本质以及EHR优化或重新设计的机会。
旭日图可视化呈现EHR导航结构,展示导航树的层级和子层级,从而能够计算一种新的度量指标——显示碎片化指数。时间带可视化展示子任务序列,并允许计算每个实例的比例,这是一种量化任务碎片化的度量指标。这些度量指标可以单独使用或结合使用,以比较EHR以及工作流程中的任务和子任务,并识别减少步骤和碎片化的机会。我们给出了一个使用这些方法比较两种不同EHR界面(商业版和可组合版)的示例,在这个示例中,受试者处理相同的患者病例。
可组合界面的屏幕切换次数大幅减少(从43次降至14次),而点击次数(包括滚动)保持相似。
这些方法有助于我们理解复杂条件和任务下的UI需求,以优化EHR工作流程并进行重新设计。