Department of Geography, School of Environment, Education and Development (SEED), University of Manchester, Arthur Lewis building (1st Floor), Oxford Road, Manchester M13 9PL, United Kingdom; Centre for Diet and Activity Research (CEDAR), MRC Epidemiology Unit, University of Cambridge, Clifford Allbutt Building, CB2 0AH, Cambridge, United Kingdom.
Department of Geography, School of Environment, Education and Development (SEED), University of Manchester, Arthur Lewis building (1st Floor), Oxford Road, Manchester M13 9PL, United Kingdom.
Sci Total Environ. 2021 Feb 10;755(Pt 1):143050. doi: 10.1016/j.scitotenv.2020.143050. Epub 2020 Oct 16.
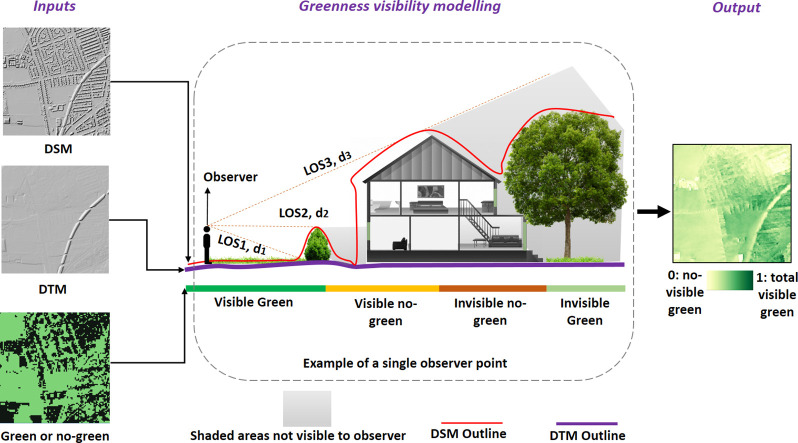
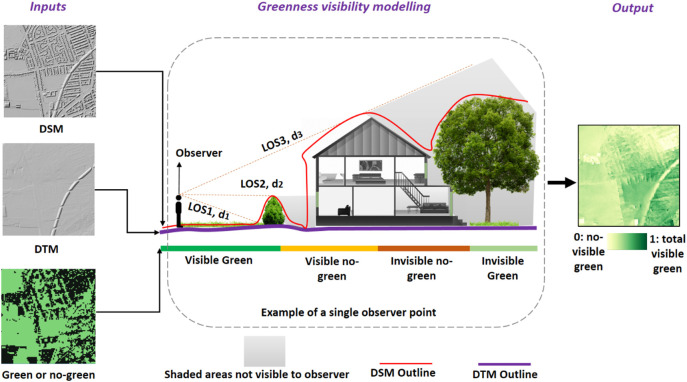
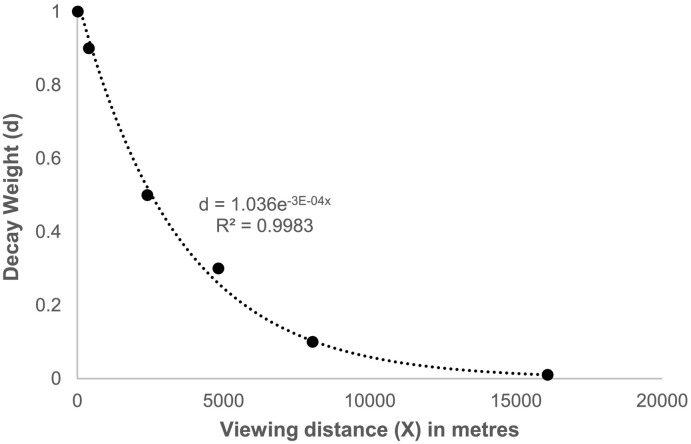
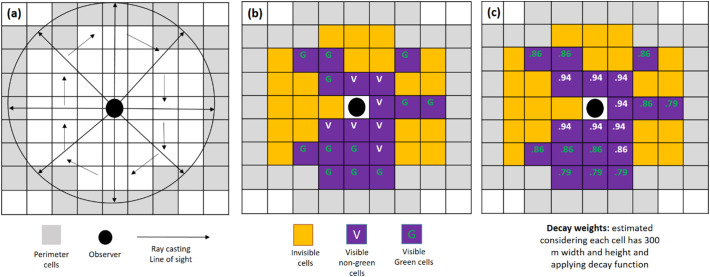
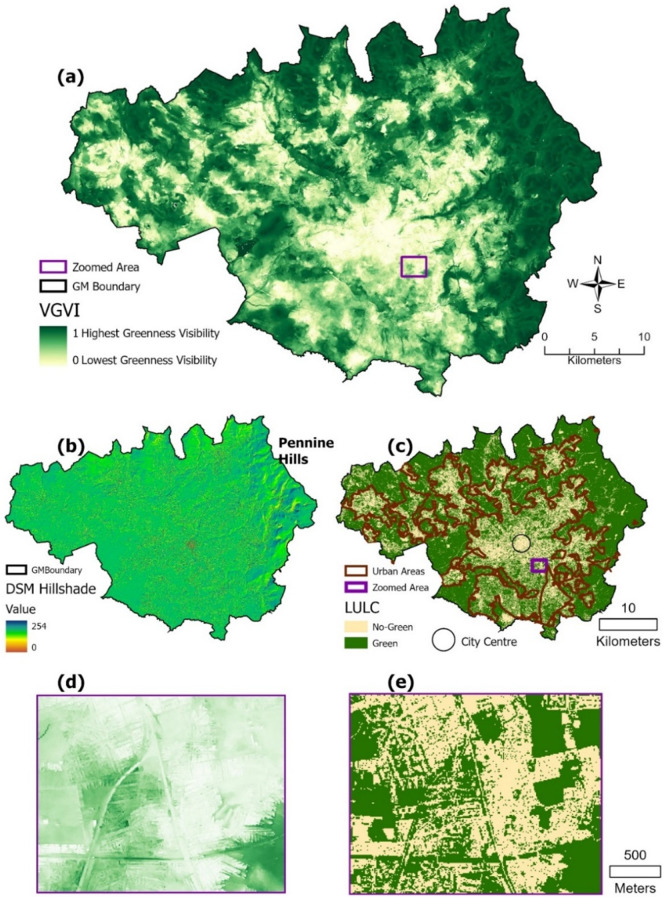
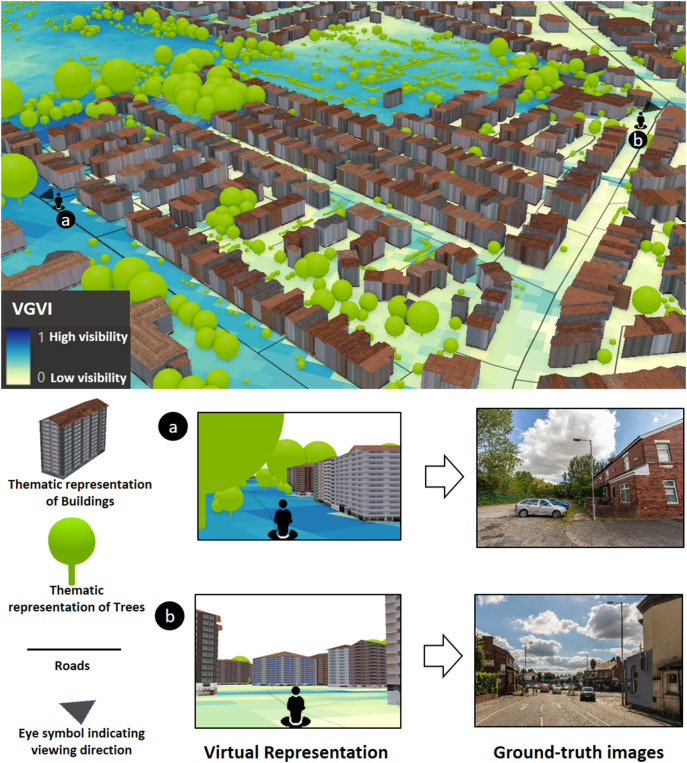
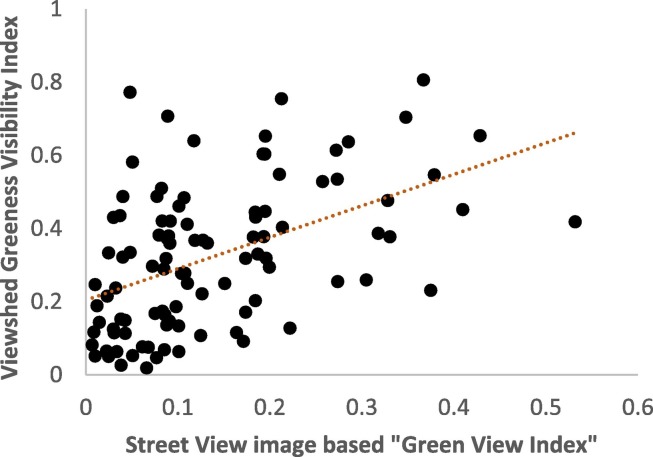
The visibility of natural greenness is associated with several health benefits along multiple pathways, including stress recovery and attention restoration mechanisms. However, existing methodologies are inadequate for capturing eye-level greenness visibility exposure at high spatial resolutions for observers located on the ground. As a response, we developed an innovative methodological approach to model and map eye-level greenness visibility exposure for 5 m interval locations within a large study area. We used multi-source spatial data and applied viewshed analysis in conjunction with a distance decay model to compute a novel Viewshed Greenness Visibility Index (VGVI) at more than 86 million observer locations. We compared our eye-level visibility exposure map with traditional top-down greenness exposure metrics such as Normalised Differential Vegetation Index (NDVI) and a Street view based Green View Index (SGVI). Furthermore, we compared greenness visibility at street-only locations with total neighbourhood greenness visibility. We found strong to moderate correlations (r = 0.65-0.42, p < 0.05) between greenness visibility and mean NDVI, with a decreasing trend in correlation strength at increasing buffer distances from observer locations. Our findings suggest that top-down and eye-level measurements of greenness are two distinct metrics for assessing greenness exposure. Additionally, VGVI showed a strong correlation (r = 0.481, p < 0.01) with SGVI. Although the new VGVI has good agreement with existing street view based measures, we found that street-only greenness visibility values are not wholly representative of total neighbourhood visibility due to the under-representation of visible greenness in locations such as backyards and community parks. Our new methodology overcomes such underestimations, is easily transferable, and offers a computationally efficient approach to assessing eye-level greenness exposure.
自然绿色度的可见性与多种健康益处相关,包括压力恢复和注意力恢复机制。然而,现有的方法学不足以在高空间分辨率下捕捉位于地面的观察者的眼平绿色度可见度暴露。作为回应,我们开发了一种创新的方法学方法来模拟和绘制大型研究区域内 5 米间隔位置的眼平绿色度可见度暴露。我们使用多源空间数据,并结合视域分析和距离衰减模型来计算超过 8600 万个观察者位置的新型视域绿色度可见度指数 (VGVI)。我们将我们的眼平可见度暴露图与传统的自上而下的绿色度暴露指标(归一化差异植被指数 (NDVI) 和基于街景的绿色视图指数 (SGVI))进行了比较。此外,我们比较了仅街道位置的绿色度可见度与整个邻里的绿色度可见度。我们发现绿色度可见度与平均 NDVI 之间存在强到中度相关性(r=0.65-0.42,p<0.05),随着观察者位置缓冲区距离的增加,相关性强度呈下降趋势。我们的研究结果表明,自上而下和眼平的绿色度测量是评估绿色度暴露的两个不同指标。此外,VGVI 与 SGVI 显示出很强的相关性(r=0.481,p<0.01)。尽管新的 VGVI 与现有的基于街景的测量方法具有良好的一致性,但我们发现由于后院和社区公园等位置的可见绿色度代表性不足,仅街道绿色度可见度值不能完全代表整个邻里的可见度。我们的新方法克服了这种低估,易于转移,并提供了一种计算效率高的方法来评估眼平绿色度暴露。