Glasgow Centre for Population Health, Glasgow, Scotland, UK
Public Health Scotland, Glasgow, Scotland, UK.
BMJ Open. 2020 Nov 5;10(11):e038135. doi: 10.1136/bmjopen-2020-038135.
Previously improving life expectancy and all-cause mortality in the UK has stalled since the early 2010s. National analyses have demonstrated changes in mortality rates for most age groups and causes of death, and with deprived populations most affected. The aims here were to establish whether similar changes have occurred across different parts of the UK (countries, cities), and to examine cause-specific trends in more detail.
Population-based trend analysis.
PARTICIPANTS/SETTING: Whole populations of countries and selected cities of the UK.
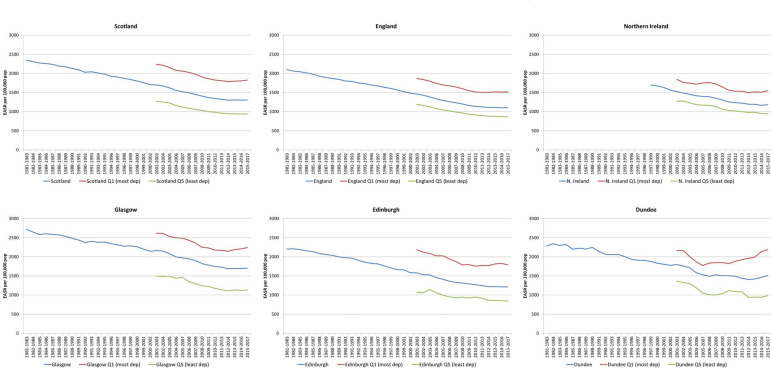
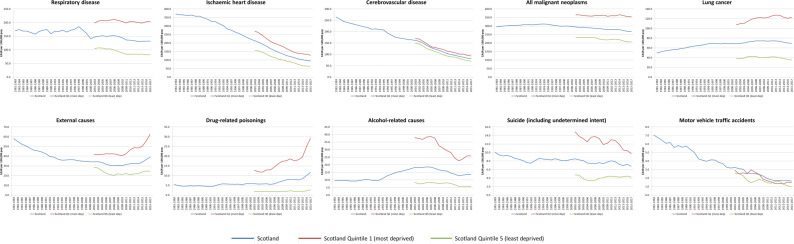
European age-standardised mortality rates (calculated by cause of death, country, city, year (1981-2017), age group, sex and-for all countries and Scottish cities-deprivation quintiles); changes in rates between 5-year periods; summary measures of both relative (relative index of inequality) and absolute (slope index of inequality) inequalities.
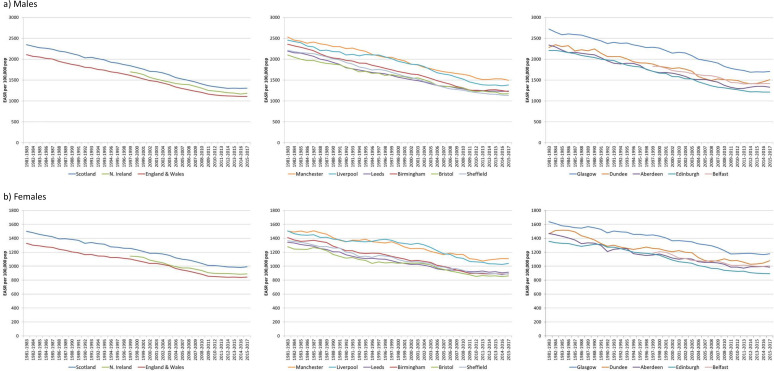
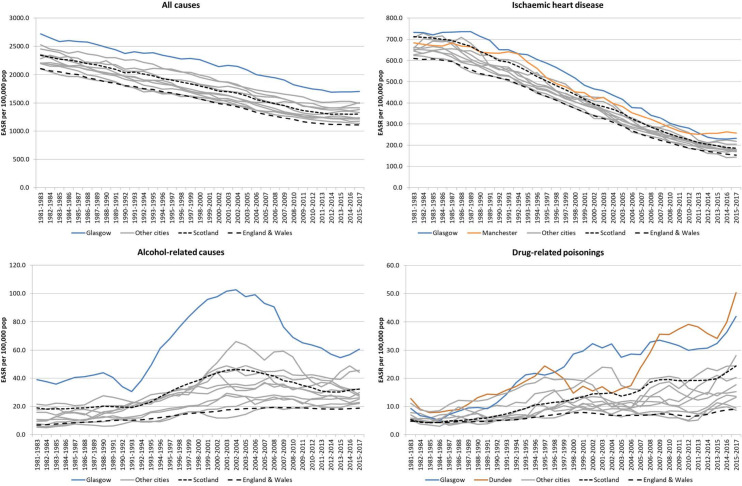
Changes in mortality from around 2011/2013 were observed throughout the UK for all adult age groups. For example, all-age female rates decreased by approximately 4%-6% during the 1980s and 1990s, approximately 7%-9% during the 2000s, but by <1% between 2011/2013 and 2015/2017. Equivalent figures for men were 4%-7%, 8%-12% and 1%-3%, respectively. This later period saw increased mortality among the most deprived populations, something observed in all countries and cities analysed, and for most causes of death: absolute and relative inequalities therefore increased. Although similar trends were seen across all parts of the UK, particular issues apply in Scotland, for example, higher and increasing drug-related mortality (with the highest rates observed in Dundee and Glasgow).
The study presents further evidence of changing mortality in the UK. The timing, geography and socioeconomic gradients associated with the changes appear to support suggestions that they may result, at least in part, from UK Government 'austerity' measures which have disproportionately affected the poorest.
自 21 世纪 10 年代初以来,英国的预期寿命和全因死亡率的提高一直停滞不前。国家分析表明,大多数年龄组和死因的死亡率都发生了变化,贫困人群受影响最大。这里的目的是确定英国不同地区(国家、城市)是否发生了类似的变化,并更详细地研究特定死因的趋势。
基于人群的趋势分析。
参与者/设置:英国国家和选定城市的全部人口。
欧洲年龄标准化死亡率(按死因、国家、城市、年份(1981-2017 年)、年龄组、性别以及所有国家和苏格兰城市的贫困五分位数计算);各 5 年期间的死亡率变化;相对(不平等相对指数)和绝对(不平等斜率指数)不平等的综合衡量标准。
在整个英国,所有成年年龄组的死亡率从 2011/2013 年左右开始发生变化。例如,在 20 世纪 80 年代和 90 年代,女性全年龄段死亡率下降了约 4%-6%,在 21 世纪 00 年代下降了约 7%-9%,但在 2011/2013 年至 2015/2017 年期间下降了不到 1%。男性的相应数字为 4%-7%、8%-12%和 1%-3%。在这一后期阶段,最贫困人群的死亡率上升,这在所有分析的国家和城市中都有观察到,并且在大多数死因中都有观察到:绝对和相对不平等因此增加。尽管英国各地都出现了类似的趋势,但苏格兰也存在一些特殊问题,例如,与毒品相关的死亡率较高且不断上升(在邓迪和格拉斯哥观察到的死亡率最高)。
本研究提供了英国死亡率变化的进一步证据。变化的时间、地理位置和社会经济梯度似乎支持了这样一种观点,即这些变化至少部分是由于英国政府的“紧缩”措施造成的,这些措施对最贫困人群的影响不成比例。