St. Luke's Health System, Kansas City, MO; University of Kansas School of Medicine, Kansas City, KS (RKT); Millennium Health, San Diego, CA (LL, MGG, PW, ED, AH).
J Addict Med. 2021;15(5):396-405. doi: 10.1097/ADM.0000000000000778.
To determine methamphetamine positivity and copositivity with other drugs in urine drug test (UDT) results geographically through time.
This cross-sectional study of UDT results from January 1, 2014, through December 31, 2019, included patient specimens submitted by health care professionals across the United States. The analysis used LC-MS/MS to detect cocaine, heroin, alcohol, marijuana and nonprescribed methamphetamine, fentanyl, methadone, buprenorphine, benzodiazepines, and other opioids. Logistic regression was used to evaluate association of demographic features and model yearly methamphetamine detection patterns across US census divisions. Odds ratios (OR) from logistic modeling were used to evaluate the impact of methamphetamine positivity on the spatio-temporal detection patterns of additional nonprescribed or illicit drugs.
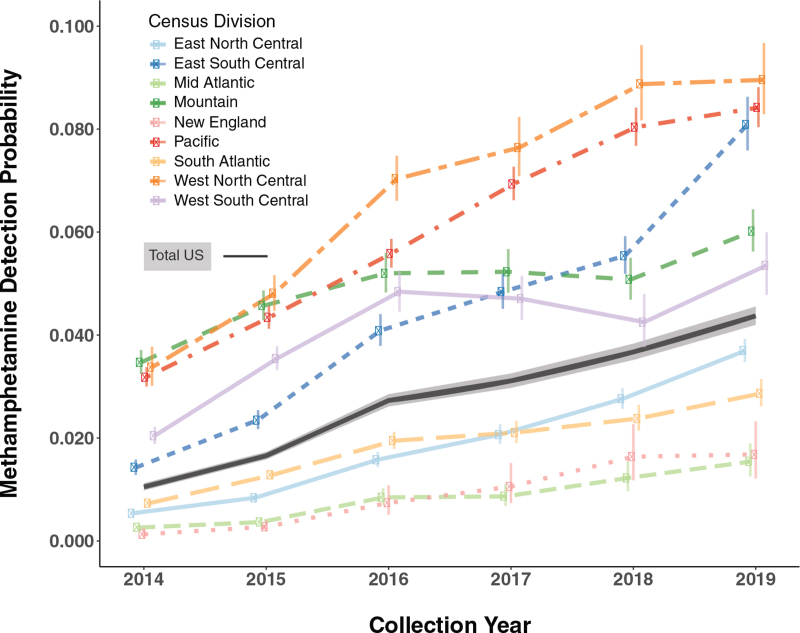
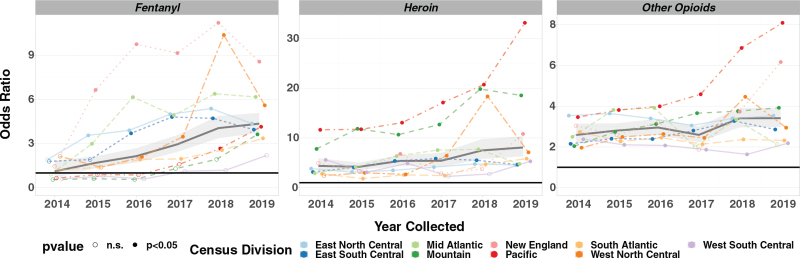
The probability of being positive for methamphetamine increased nationally from 0.010 [0.010-0.011] in 2014 to 0.044 [0.042-0.046] in 2019, a 340% increase after correction for demographic covariates. The highest predicted positivity rate was in male patients, 25- to 34-years-old, from the West North Central division and from substance use disorder treatment centers. Nationally, copositivity ORs for fentanyl, heroin, and other opioids with methamphetamine were highest in 2019. Increases in ORs from 2014 through 2019 were statistically significant for heroin (P = 0.024) and fentanyl (P = 0.0085). Copositivity ORs for methamphetamine and other substances varied by census division.
The probability of being positive for methamphetamine in UDT increased nationwide between 2014 and 2019. Not all census divisions are increasing at the same rate. Copositivity with additional substances is increasing in some census divisions, which further increases the risk of overdose and poor treatment outcomes.
通过时间和地理上的尿液药物检测(UDT)结果,确定苯丙胺呈阳性和与其他药物共同呈阳性的情况。
本研究为 2014 年 1 月 1 日至 2019 年 12 月 31 日期间的 UDT 结果的横断面研究,包含来自全美各地医疗保健专业人员提交的患者标本。分析采用 LC-MS/MS 检测可卡因、海洛因、酒精、大麻和非处方苯丙胺、芬太尼、美沙酮、丁丙诺啡、苯二氮䓬类药物和其他阿片类药物。采用逻辑回归评估人口统计学特征与美国人口普查分部的年度苯丙胺检测模式之间的关联。逻辑模型的比值比(OR)用于评估苯丙胺呈阳性对其他非处方或非法药物时空检测模式的影响。
全国范围内,苯丙胺呈阳性的概率从 2014 年的 0.010[0.010-0.011]增加到 2019 年的 0.044[0.042-0.046],经人口统计学协变量校正后增加了 340%。预测阳性率最高的是男性患者、25 至 34 岁,来自西北中部地区和物质使用障碍治疗中心。全国范围内,2019 年与苯丙胺共同呈阳性的芬太尼、海洛因和其他阿片类药物的比值比(OR)最高。2014 年至 2019 年,海洛因(P=0.024)和芬太尼(P=0.0085)的 OR 增加具有统计学意义。按人口普查分部划分,苯丙胺与其他物质共同呈阳性的 OR 有所不同。
2014 年至 2019 年间,全美范围内 UDT 检测苯丙胺呈阳性的概率增加。并非所有的人口普查分部都以相同的速度增加。一些人口普查分部与其他物质共同呈阳性的比例增加,这进一步增加了过量用药和治疗效果不佳的风险。