Kigozi Simon P, Kigozi Ruth N, Sebuguzi Catherine M, Cano Jorge, Rutazaana Damian, Opigo Jimmy, Bousema Teun, Yeka Adoke, Gasasira Anne, Sartorius Benn, Pullan Rachel L
Department of Disease Control, London School of Hygiene & Tropical Medicine, Keppel Street, London, WC1E 7HT, UK.
Infectious Diseases Research Collaboration, PO Box 7475, Kampala, Uganda.
BMC Public Health. 2020 Dec 14;20(1):1913. doi: 10.1186/s12889-020-10007-w.
As global progress to reduce malaria transmission continues, it is increasingly important to track changes in malaria incidence rather than prevalence. Risk estimates for Africa have largely underutilized available health management information systems (HMIS) data to monitor trends. This study uses national HMIS data, together with environmental and geographical data, to assess spatial-temporal patterns of malaria incidence at facility catchment level in Uganda, over a recent 5-year period.
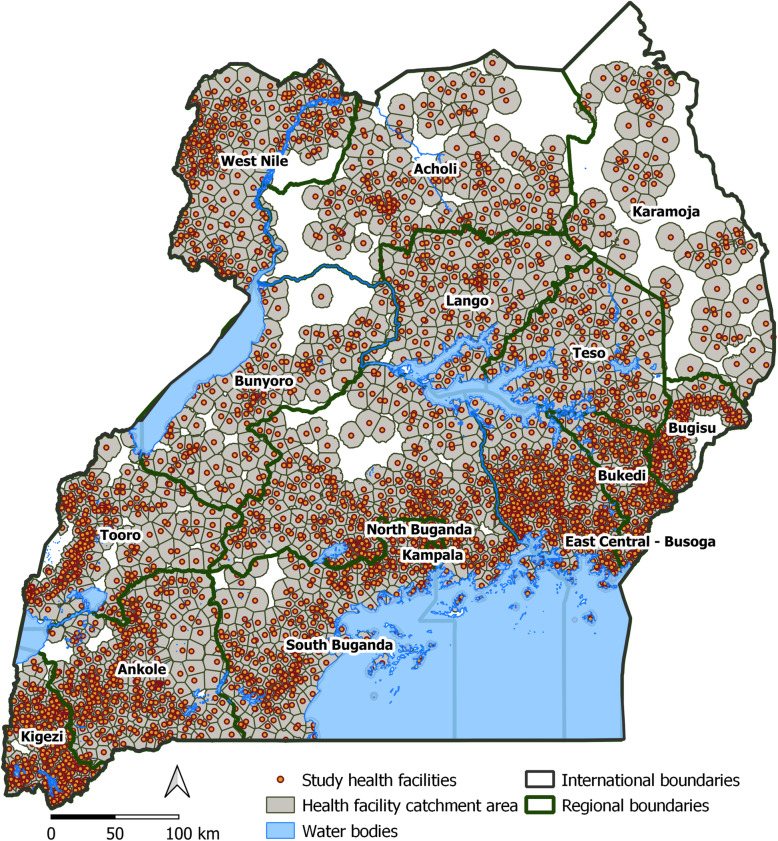
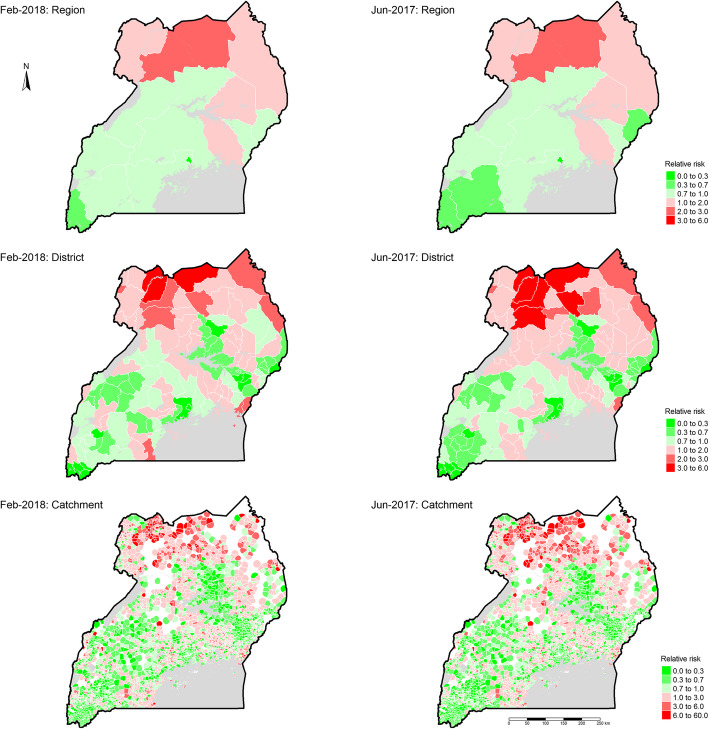
Data reported by 3446 health facilities in Uganda, between July 2015 and September 2019, was analysed. To assess the geographic accessibility of the health facilities network, AccessMod was employed to determine a three-hour cost-distance catchment around each facility. Using confirmed malaria cases and total catchment population by facility, an ecological Bayesian conditional autoregressive spatial-temporal Poisson model was fitted to generate monthly posterior incidence rate estimates, adjusted for caregiver education, rainfall, land surface temperature, night-time light (an indicator of urbanicity), and vegetation index.
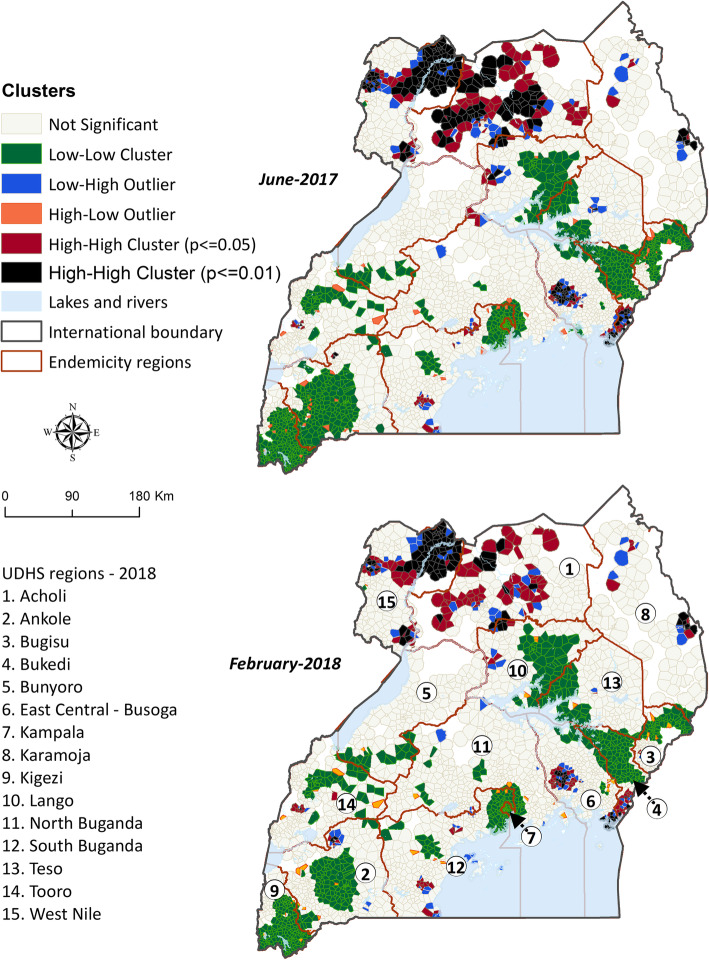
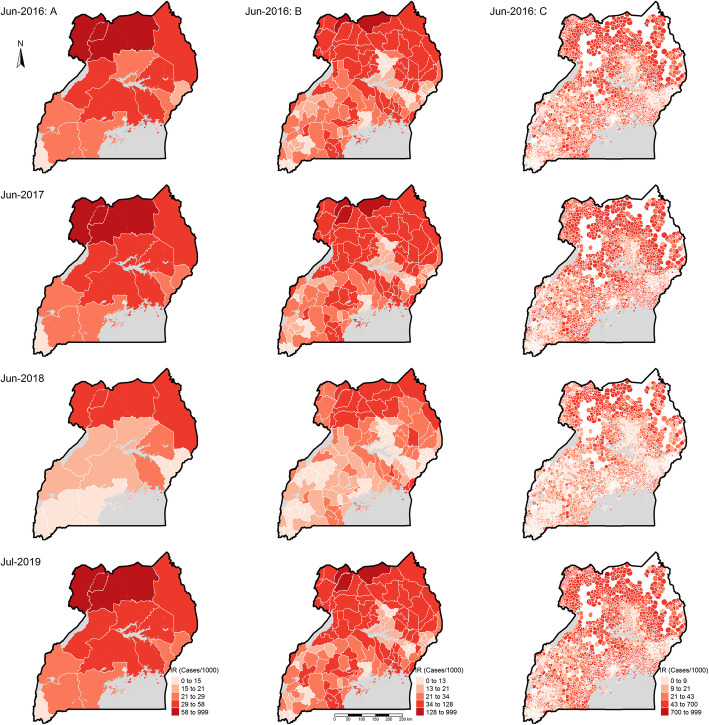
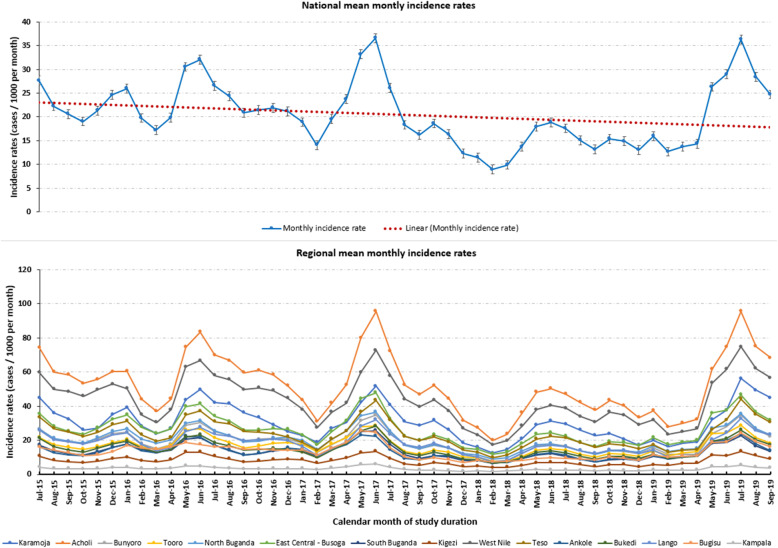
An estimated 38.8 million (95% Credible Interval [CI]: 37.9-40.9) confirmed cases of malaria occurred over the period, with a national mean monthly incidence rate of 20.4 (95% CI: 19.9-21.5) cases per 1000, ranging from 8.9 (95% CI: 8.7-9.4) to 36.6 (95% CI: 35.7-38.5) across the study period. Strong seasonality was observed, with June-July experiencing highest peaks and February-March the lowest peaks. There was also considerable geographic heterogeneity in incidence, with health facility catchment relative risk during peak transmission months ranging from 0 to 50.5 (95% CI: 49.0-50.8) times higher than national average. Both districts and health facility catchments showed significant positive spatial autocorrelation; health facility catchments had global Moran's I = 0.3 (p < 0.001) and districts Moran's I = 0.4 (p < 0.001). Notably, significant clusters of high-risk health facility catchments were concentrated in Acholi, West Nile, Karamoja, and East Central - Busoga regions.
Findings showed clear countrywide spatial-temporal patterns with clustering of malaria risk across districts and health facility catchments within high risk regions, which can facilitate targeting of interventions to those areas at highest risk. Moreover, despite high and perennial transmission, seasonality for malaria incidence highlights the potential for optimal and timely implementation of targeted interventions.
随着全球在减少疟疾传播方面不断取得进展,追踪疟疾发病率而非患病率的变化变得越来越重要。非洲的风险评估在很大程度上未充分利用现有的卫生管理信息系统(HMIS)数据来监测趋势。本研究使用国家HMIS数据以及环境和地理数据,评估乌干达最近5年期间医疗机构集水区层面疟疾发病率的时空模式。
分析了乌干达3446家医疗机构在2015年7月至2019年9月期间报告的数据。为了评估医疗机构网络的地理可达性,使用AccessMod确定每个医疗机构周围三小时成本距离的集水区。利用各医疗机构确诊的疟疾病例和集水区总人口,拟合了一个生态贝叶斯条件自回归时空泊松模型,以生成每月的后验发病率估计值,并根据照顾者教育程度、降雨量、地表温度、夜间灯光(城市化指标)和植被指数进行调整。
在此期间,估计发生了3880万例(95%可信区间[CI]:3790 - 4090万)确诊疟疾病例,全国平均每月发病率为每1000人20.4例(95%CI:19.9 - 21.5),在整个研究期间从8.9例(95%CI:8.7 - 9.4)到36.6例(95%CI:35.7 - 38.5)不等。观察到强烈的季节性,6月至7月出现最高峰,2月至3月出现最低峰。发病率在地理上也存在相当大的异质性,在传播高峰期,医疗机构集水区的相对风险比全国平均水平高0至50.5倍(95%CI:49.0 - 50.8)。地区和医疗机构集水区均显示出显著的正空间自相关性;医疗机构集水区的全局莫兰指数I = 0.3(p < 0.001),地区莫兰指数I = 0.4(p < 0.001)。值得注意的是,高风险医疗机构集水区的显著聚集集中在阿乔利、西尼罗河、卡拉莫贾和东中部 - 布索加地区。
研究结果显示出全国范围内清晰的时空模式,疟疾风险在各地区以及高风险地区内的医疗机构集水区存在聚集现象,这有助于将干预措施针对那些风险最高的地区。此外,尽管疟疾传播率高且常年存在,但发病率的季节性突出了针对性干预措施最佳和及时实施的潜力。