• 文献检索
  • 文档翻译
  • 深度研究
  • 学术资讯
  • Suppr Zotero 插件Zotero 插件
  • 邀请有礼
  • 套餐&价格
  • 历史记录
应用&插件
Suppr Zotero 插件Zotero 插件浏览器插件Mac 客户端Windows 客户端微信小程序
定价
高级版会员购买积分包购买API积分包
服务
文献检索文档翻译深度研究API 文档MCP 服务
关于我们
关于 Suppr公司介绍联系我们用户协议隐私条款
关注我们

Suppr 超能文献

核心技术专利:CN118964589B侵权必究
粤ICP备2023148730 号-1Suppr @ 2026

文献检索

告别复杂PubMed语法,用中文像聊天一样搜索,搜遍4000万医学文献。AI智能推荐,让科研检索更轻松。

立即免费搜索

文件翻译

保留排版,准确专业,支持PDF/Word/PPT等文件格式,支持 12+语言互译。

免费翻译文档

深度研究

AI帮你快速写综述,25分钟生成高质量综述,智能提取关键信息,辅助科研写作。

立即免费体验

利用三阶段统计模型中的遥感产品对印度中部地区的 PM 进行人群暴露评估。

Population exposure across central India to PM derived using remotely sensed products in a three-stage statistical model.

机构信息

Department of Earth and Environmental Sciences, Indian Institute of Science Education and Research Bhopal, Bhopal Bypass Road, Bhauri, Bhopal, Madhya Pradesh, 462 066, India.

Center for Research on Environment and Sustainable Technologies, Indian Institute of Science Education and Research Bhopal, Bhopal Bypass Road, Bhauri, Bhopal, Madhya Pradesh, 462 066, India.

出版信息

Sci Rep. 2021 Jan 12;11(1):544. doi: 10.1038/s41598-020-79229-7.

DOI:10.1038/s41598-020-79229-7
PMID:33436655
原文链接:https://pmc.ncbi.nlm.nih.gov/articles/PMC7804491/
Abstract

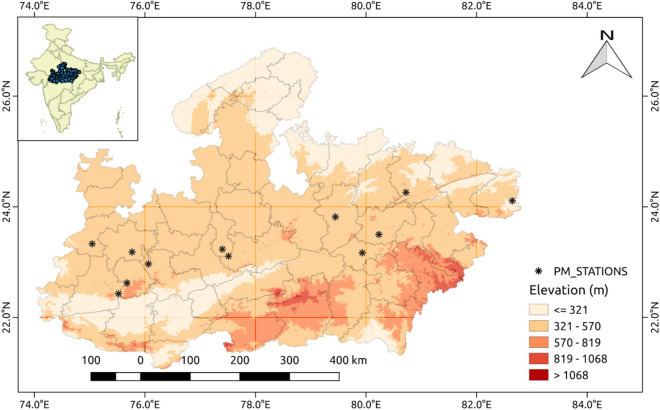
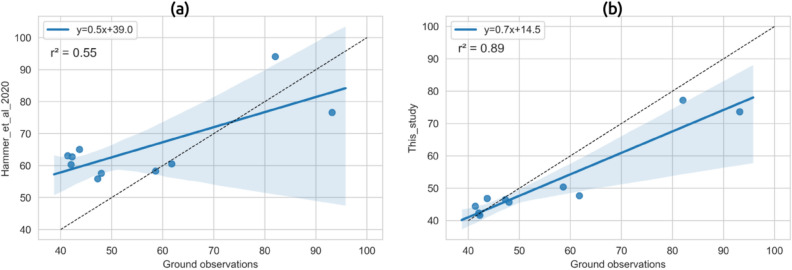
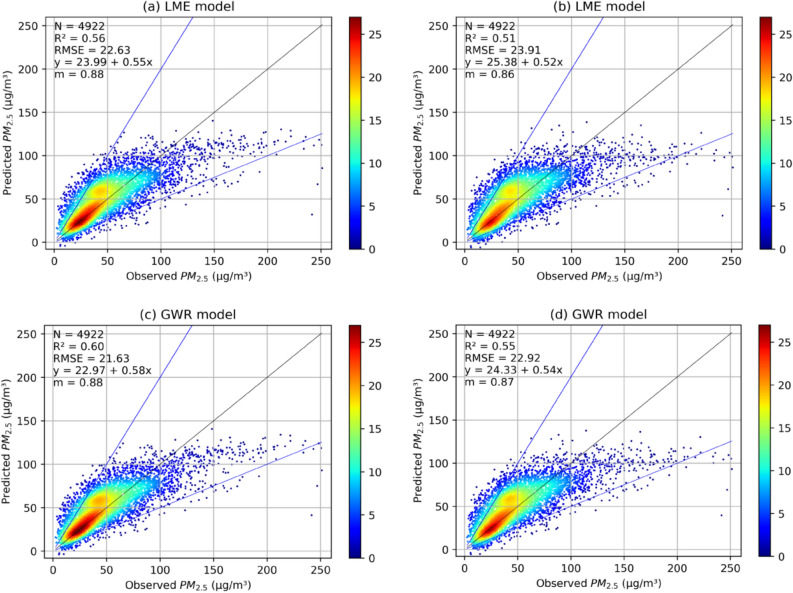
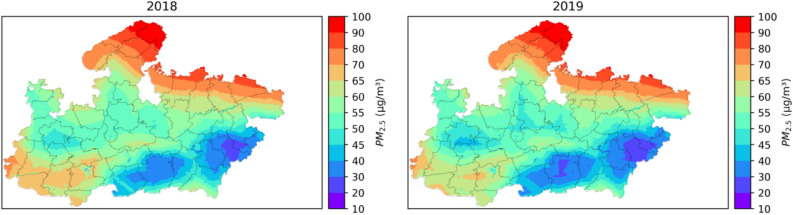
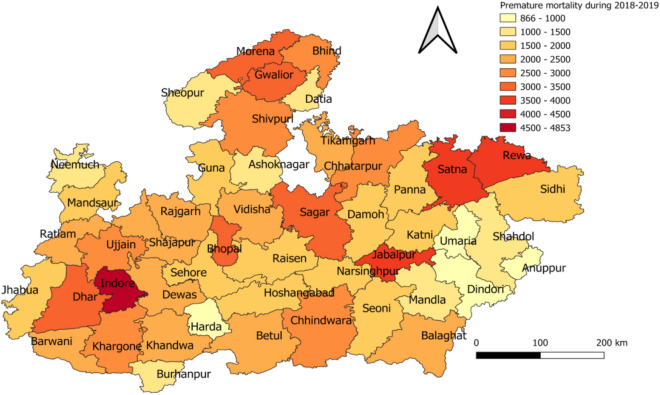
Surface PM concentrations are required for exposure assessment studies. Remotely sensed Aerosol Optical Depth (AOD) has been used to derive PM where ground data is unavailable. However, two key challenges in estimating surface PM from AOD using statistical models are (i) Satellite data gaps, and (ii) spatio-temporal variability in AOD-PM relationships. In this study, we estimated spatially continuous (0.03° × 0.03°) daily surface PM concentrations using MAIAC AOD over Madhya Pradesh (MP), central India for 2018 and 2019, and validated our results against surface measurements. Daily MAIAC AOD gaps were filled using MERRA-2 AOD. Imputed AOD together with MERRA-2 meteorology and land use information were then used to develop a linear mixed effect (LME) model. Finally, a geographically weighted regression was developed using the LME output to capture spatial variability in AOD-PM relationship. Final Cross-Validation (CV) correlation coefficient, r, between modelled and observed PM varied from 0.359 to 0.689 while the Root Mean Squared Error (RMSE) varied from 15.83 to 35.85 µg m, over the entire study region during the study period. Strong seasonality was observed with winter seasons (2018 and 2019) PM concentration (mean value 82.54 µg m) being the highest and monsoon seasons being the lowest (mean value of 32.10 µg m). Our results show that MP had a mean PM concentration of 58.19 µg m and 56.32 µg m for 2018 and 2019, respectively, which likely caused total premature deaths of 0.106 million (0.086, 0.128) at the 95% confidence interval including 0.056 million (0.045, 0.067) deaths due to Ischemic Heart Disease (IHD), 0.037 million (0.031, 0.045) due to strokes, 0.012 million (0.009, 0.014) due to Chronic Obstructive Pulmonary Disease (COPD), and 1.2 thousand (1.0, 1.5) due to lung cancer (LNC) during this period.

摘要

需要进行表面 PM 浓度的评估研究。在没有地面数据的情况下,使用遥感气溶胶光学深度(AOD)来推导 PM。然而,使用统计模型从 AOD 估算地面 PM 存在两个关键挑战:(i)卫星数据空白,以及(ii)AOD-PM 关系的时空可变性。在这项研究中,我们利用印度中央邦(MP)2018 年和 2019 年的 MAIAC AOD 估算了空间连续(0.03°×0.03°)的日平均地面 PM 浓度,并将结果与地面测量结果进行了验证。利用 MERRA-2 AOD 填补了每日 MAIAC AOD 空白。然后,使用估算的 AOD 以及 MERRA-2 气象和土地利用信息,开发了一个线性混合效应(LME)模型。最后,使用 LME 输出开发了一个地理加权回归模型,以捕捉 AOD-PM 关系的空间可变性。在整个研究期间,模型化和观测 PM 之间的最终交叉验证(CV)相关系数 r 在 0.359 到 0.689 之间变化,而均方根误差(RMSE)在 15.83 到 35.85μg/m 之间变化。在研究期间,冬季(2018 年和 2019 年)PM 浓度(平均 82.54μg/m)最高,而季风季节(平均 32.10μg/m)最低,呈现出强烈的季节性。结果表明,MP 的 PM 平均浓度分别为 2018 年的 58.19μg/m 和 2019 年的 56.32μg/m,这可能导致总过早死亡人数为 0.106 万人(95%置信区间为 0.086 万至 0.128 万),其中包括 0.056 万人(95%置信区间为 0.045 万至 0.067 万)死于缺血性心脏病(IHD),0.037 万人(95%置信区间为 0.031 万至 0.045 万)死于中风,0.012 万人(95%置信区间为 0.009 万至 0.014 万)死于慢性阻塞性肺病(COPD),以及 1.2 千人(95%置信区间为 1.0 万至 1.5 万)死于肺癌(LNC)。

https://cdn.ncbi.nlm.nih.gov/pmc/blobs/8f08/7804491/2f1588de9d2e/41598_2020_79229_Fig7_HTML.jpg
https://cdn.ncbi.nlm.nih.gov/pmc/blobs/8f08/7804491/d3ddef2c34c9/41598_2020_79229_Fig1_HTML.jpg
https://cdn.ncbi.nlm.nih.gov/pmc/blobs/8f08/7804491/8d5da8ca175e/41598_2020_79229_Fig2_HTML.jpg
https://cdn.ncbi.nlm.nih.gov/pmc/blobs/8f08/7804491/87600c2738bf/41598_2020_79229_Fig3_HTML.jpg
https://cdn.ncbi.nlm.nih.gov/pmc/blobs/8f08/7804491/55f4b6d562c7/41598_2020_79229_Fig4_HTML.jpg
https://cdn.ncbi.nlm.nih.gov/pmc/blobs/8f08/7804491/4e1e4f7a7bf5/41598_2020_79229_Fig5_HTML.jpg
https://cdn.ncbi.nlm.nih.gov/pmc/blobs/8f08/7804491/030519f651c9/41598_2020_79229_Fig6_HTML.jpg
https://cdn.ncbi.nlm.nih.gov/pmc/blobs/8f08/7804491/2f1588de9d2e/41598_2020_79229_Fig7_HTML.jpg

相似文献

1
Population exposure across central India to PM derived using remotely sensed products in a three-stage statistical model.利用三阶段统计模型中的遥感产品对印度中部地区的 PM 进行人群暴露评估。
Sci Rep. 2021 Jan 12;11(1):544. doi: 10.1038/s41598-020-79229-7.
2
Assessment and statistical modeling of the relationship between remotely sensed aerosol optical depth and PM2.5 in the eastern United States.美国东部地区遥感气溶胶光学厚度与PM2.5之间关系的评估及统计建模
Res Rep Health Eff Inst. 2012 May(167):5-83; discussion 85-91.
3
Estimating ground level PM concentrations and associated health risk in India using satellite based AOD and WRF predicted meteorological parameters.利用卫星观测的大气光学厚度(AOD)和 WRF 预测气象参数估算印度的地面 PM 浓度及其相关健康风险。
Chemosphere. 2020 Sep;255:126969. doi: 10.1016/j.chemosphere.2020.126969. Epub 2020 May 4.
4
Spatial analysis of MODIS aerosol optical depth, PM2.5, and chronic coronary heart disease.MODIS 气溶胶光学深度、PM2.5 与慢性冠心病的空间分析。
Int J Health Geogr. 2009 May 12;8:27. doi: 10.1186/1476-072X-8-27.
5
Estimating national-scale ground-level PM25 concentration in China using geographically weighted regression based on MODIS and MISR AOD.基于中分辨率成像光谱仪(MODIS)和多角度成像光谱辐射计(MISR)气溶胶光学厚度,运用地理加权回归法估算中国全国尺度的地面细颗粒物(PM2.5)浓度。
Environ Sci Pollut Res Int. 2016 May;23(9):8327-38. doi: 10.1007/s11356-015-6027-9. Epub 2016 Jan 16.
6
Using MAIAC AOD to verify the PM spatial patterns of a land use regression model.利用 MAIA C AOD 验证土地利用回归模型的 PM 空间分布。
Environ Pollut. 2018 Dec;243(Pt A):501-509. doi: 10.1016/j.envpol.2018.09.026. Epub 2018 Sep 6.
7
Incorporating long-term satellite-based aerosol optical depth, localized land use data, and meteorological variables to estimate ground-level PM concentrations in Taiwan from 2005 to 2015.利用长期卫星气溶胶光学深度、本地化土地利用数据和气象变量来估算 2005 年至 2015 年台湾地区地面 PM 浓度。
Environ Pollut. 2018 Jun;237:1000-1010. doi: 10.1016/j.envpol.2017.11.016. Epub 2017 Nov 20.
8
An interpretable self-adaptive deep neural network for estimating daily spatially-continuous PM concentrations across China.用于估算中国境内逐日空间连续 PM 浓度的可解释自适应深度神经网络。
Sci Total Environ. 2021 May 10;768:144724. doi: 10.1016/j.scitotenv.2020.144724. Epub 2021 Jan 5.
9
Estimating ground-level PM2.5 in China using satellite remote sensing.利用卫星遥感估算中国的地面 PM2.5 浓度。
Environ Sci Technol. 2014 Jul 1;48(13):7436-44. doi: 10.1021/es5009399. Epub 2014 Jun 13.
10
10-year spatial and temporal trends of PM concentrations in the southeastern US estimated using high-resolution satellite data.利用高分辨率卫星数据估算美国东南部PM浓度的10年时空趋势。
Atmos Chem Phys. 2014;14(12):6301-6314. doi: 10.5194/acp-14-6301-2014. Epub 2014 Jun 25.

引用本文的文献

1
Global disparities in indoor wildfire-PM exposure and mitigation costs.室内野火细颗粒物暴露及缓解成本的全球差异
Sci Adv. 2025 May 16;11(20):eads4360. doi: 10.1126/sciadv.ads4360. Epub 2025 May 14.
2
The expression of miR-21, HSP90a and gGASP-1 in serum of patients with lung cancer and their correlation with pathological subtypes.肺癌患者血清中miR-21、HSP90a和gGASP-1的表达及其与病理亚型的相关性。
J Med Biochem. 2024 Jun 15;43(4):460-468. doi: 10.5937/jomb0-48051.
3
Evaluating TROPOMI and MODIS performance to capture the dynamic of air pollution in São Paulo state: A case study during the COVID-19 outbreak.

本文引用的文献

1
The MERRA-2 Aerosol Reanalysis, 1980 Onward. Part II: Evaluation and Case Studies.MERRA-2气溶胶再分析,始于1980年。第二部分:评估与案例研究。
J Clim. 2017 Sep 1;30(17):6851-6872. doi: 10.1175/jcli-d-16-0613.1. Epub 2017 Jul 27.
2
Global Estimates and Long-Term Trends of Fine Particulate Matter Concentrations (1998-2018).全球细颗粒物浓度(1998-2018 年)估计数和长期趋势。
Environ Sci Technol. 2020 Jul 7;54(13):7879-7890. doi: 10.1021/acs.est.0c01764. Epub 2020 Jun 17.
3
Estimating ground level PM concentrations and associated health risk in India using satellite based AOD and WRF predicted meteorological parameters.
评估TROPOMI和MODIS捕捉圣保罗州空气污染动态的性能:以新冠疫情期间为例
Remote Sens Environ. 2023 May 1;289:113514. doi: 10.1016/j.rse.2023.113514. Epub 2023 Feb 21.
4
Characteristics and health risk assessment of fine particulate matter and surface ozone: results from Bengaluru, India.细颗粒物和表面臭氧的特征及健康风险评估:来自印度班加罗尔的结果。
Environ Monit Assess. 2022 Feb 23;194(3):211. doi: 10.1007/s10661-022-09852-6.
利用卫星观测的大气光学厚度(AOD)和 WRF 预测气象参数估算印度的地面 PM 浓度及其相关健康风险。
Chemosphere. 2020 Sep;255:126969. doi: 10.1016/j.chemosphere.2020.126969. Epub 2020 May 4.
4
Cause and Age-specific premature mortality attributable to PM Exposure: An analysis for Million-Plus Indian cities.归因于 PM 暴露的原因和年龄特异性过早死亡率:对百万以上印度城市的分析。
Sci Total Environ. 2020 Mar 25;710:135230. doi: 10.1016/j.scitotenv.2019.135230. Epub 2019 Nov 30.
5
Satellite-based high-resolution mapping of ground-level PM concentrations over East China using a spatiotemporal regression kriging model.利用时空回归克里金模型对中国东部地面PM浓度进行基于卫星的高分辨率制图。
Sci Total Environ. 2019 Jul 1;672:479-490. doi: 10.1016/j.scitotenv.2019.03.480. Epub 2019 Apr 2.
6
Estimation of daily PM and PM concentrations in Italy, 2013-2015, using a spatiotemporal land-use random-forest model.利用时空土地利用随机森林模型估算 2013-2015 年意大利的日 PM 和 PM 浓度。
Environ Int. 2019 Mar;124:170-179. doi: 10.1016/j.envint.2019.01.016. Epub 2019 Jan 14.
7
Evaluation of the Multi-Angle Implementation of Atmospheric Correction (MAIAC) Aerosol Algorithm through Intercomparison with VIIRS Aerosol Products and AERONET.通过与VIIRS气溶胶产品和AERONET进行比对评估大气校正多角度实现(MAIAC)气溶胶算法
J Geophys Res Atmos. 2017 Mar 16;122(5):3005-3022. doi: 10.1002/2016JD025720. Epub 2017 Jan 29.
8
The MERRA-2 Aerosol Reanalysis, 1980 - onward, Part I: System Description and Data Assimilation Evaluation.MERRA-2气溶胶再分析,1980年起,第一部分:系统描述与数据同化评估。
J Clim. 2017 Sep;30(17):6823-6850. doi: 10.1175/JCLI-D-16-0609.1. Epub 2017 Jul 27.
9
Estimates and 25-year trends of the global burden of disease attributable to ambient air pollution: an analysis of data from the Global Burden of Diseases Study 2015.归因于环境空气污染的全球疾病负担估计数和 25 年趋势:2015 年全球疾病负担研究数据分析。
Lancet. 2017 May 13;389(10082):1907-1918. doi: 10.1016/S0140-6736(17)30505-6. Epub 2017 Apr 10.
10
Can dispersion modeling of air pollution be improved by land-use regression? An example from Stockholm, Sweden.土地利用回归能否改善空气污染的扩散模型?以瑞典斯德哥尔摩为例。
J Expo Sci Environ Epidemiol. 2017 Nov;27(6):575-581. doi: 10.1038/jes.2016.40. Epub 2016 Aug 3.