• 文献检索
  • 文档翻译
  • 深度研究
  • 学术资讯
  • Suppr Zotero 插件Zotero 插件
  • 邀请有礼
  • 套餐&价格
  • 历史记录
应用&插件
Suppr Zotero 插件Zotero 插件浏览器插件Mac 客户端Windows 客户端微信小程序
定价
高级版会员购买积分包购买API积分包
服务
文献检索文档翻译深度研究API 文档MCP 服务
关于我们
关于 Suppr公司介绍联系我们用户协议隐私条款
关注我们

Suppr 超能文献

核心技术专利:CN118964589B侵权必究
粤ICP备2023148730 号-1Suppr @ 2026

文献检索

告别复杂PubMed语法,用中文像聊天一样搜索,搜遍4000万医学文献。AI智能推荐,让科研检索更轻松。

立即免费搜索

文件翻译

保留排版,准确专业,支持PDF/Word/PPT等文件格式,支持 12+语言互译。

免费翻译文档

深度研究

AI帮你快速写综述,25分钟生成高质量综述,智能提取关键信息,辅助科研写作。

立即免费体验

关于分类器分布中的信息隐藏。

On the information hidden in a classifier distribution.

机构信息

R&D Headquarters, Petroleum Industry Health Organization Polyclinic, Eram Blvd, 7143837877, Shiraz, Iran.

Persian BayanGene Research and Training Center, Shiraz University of Medical Sciences, Shiraz, Iran.

出版信息

Sci Rep. 2021 Jan 13;11(1):917. doi: 10.1038/s41598-020-79548-9.

DOI:10.1038/s41598-020-79548-9
PMID:33441644
原文链接:https://pmc.ncbi.nlm.nih.gov/articles/PMC7807039/
Abstract

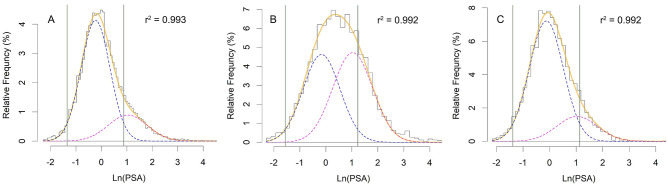
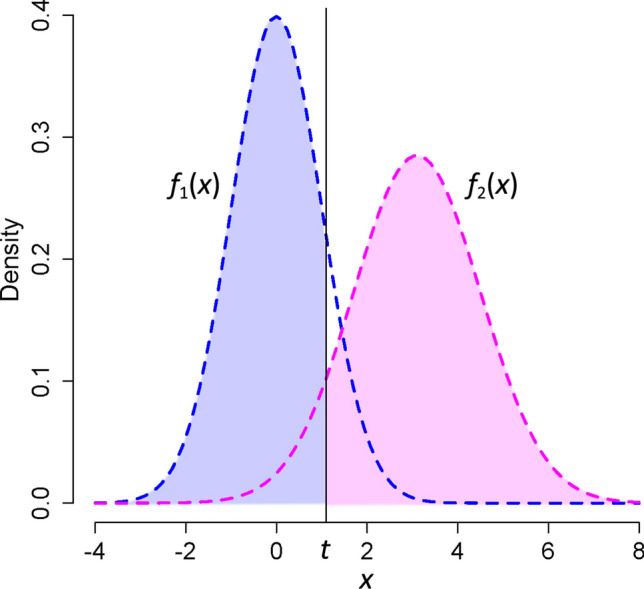
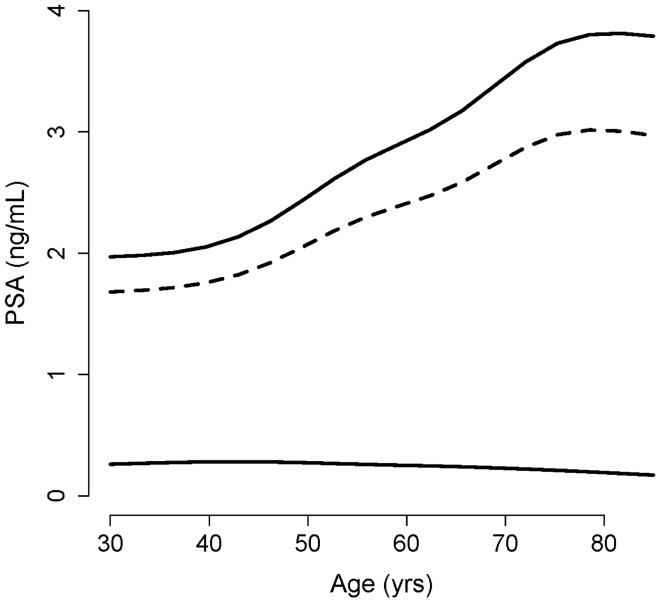
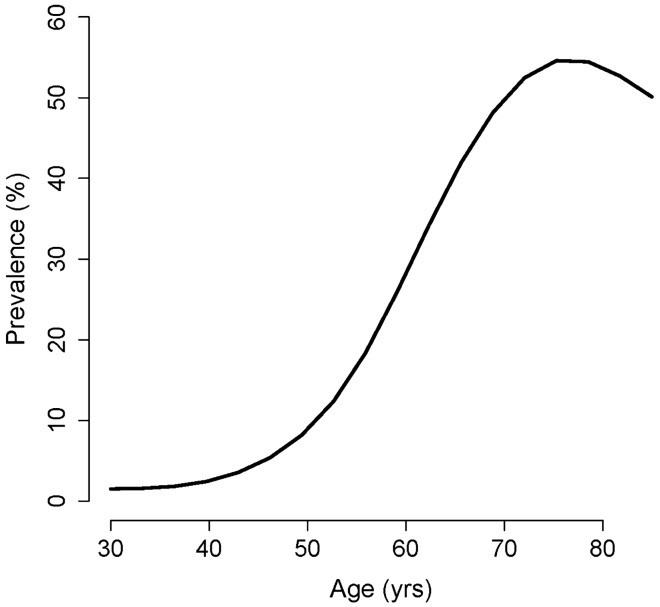
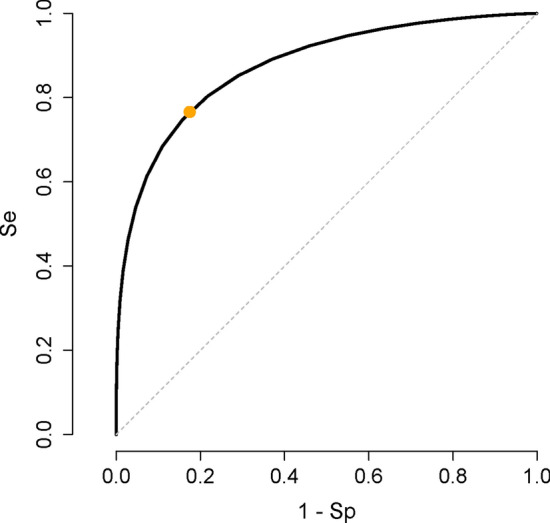
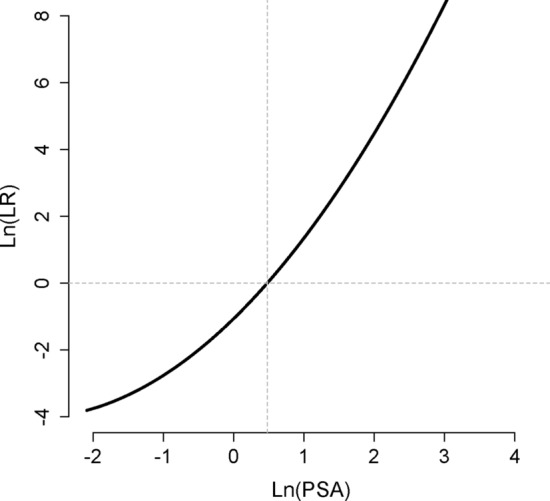
Classification tasks are a common challenge to every field of science. To correctly interpret the results provided by a classifier, we need to know the performance indices of the classifier including its sensitivity, specificity, the most appropriate cut-off value (for continuous classifiers), etc. Typically, several studies should be conducted to find all these indices. Herein, we show that they already exist, hidden in the distribution of the variable used to classify, and can readily be harvested. An educated guess about the distribution of the variable used to classify in each class would help us to decompose the frequency distribution of the variable in population into its components-the probability density function of the variable in each class. Based on the harvested parameters, we can then calculate the performance indices of the classifier. As a case study, we applied the technique to the relative frequency distribution of prostate-specific antigen, a biomarker commonly used in medicine for the diagnosis of prostate cancer. We used nonlinear curve fitting to decompose the variable relative frequency distribution into the probability density functions of the non-diseased and diseased people. The functions were then used to determine the performance indices of the classifier. Sensitivity, specificity, the most appropriate cut-off value, and likelihood ratios were calculated. The reference range of the biomarker and the prevalence of prostate cancer for various age groups were also calculated. The indices obtained were in good agreement with the values reported in previous studies. All these were done without being aware of the real health status of the individuals studied. The method is even applicable for conditions with no definite definitions (e.g., hypertension). We believe the method has a wide range of applications in many scientific fields.

摘要

分类任务是每个科学领域都面临的共同挑战。为了正确解释分类器提供的结果,我们需要了解分类器的性能指标,包括其灵敏度、特异性、最合适的截止值(对于连续分类器)等。通常需要进行多项研究来找到所有这些指标。在这里,我们表明它们已经存在于用于分类的变量的分布中,并且可以轻松地被挖掘出来。对每个类别中用于分类的变量的分布进行有根据的猜测,将有助于我们将总体中变量的频率分布分解为其组成部分——每个类别中变量的概率密度函数。基于收获的参数,我们可以计算分类器的性能指标。作为案例研究,我们将该技术应用于前列腺特异性抗原(PSA)的相对频率分布,这是医学中常用于诊断前列腺癌的一种生物标志物。我们使用非线性曲线拟合将变量相对频率分布分解为非患病和患病人群的概率密度函数。然后使用这些函数来确定分类器的性能指标。计算了灵敏度、特异性、最合适的截止值和似然比。还计算了生物标志物的参考范围和不同年龄组前列腺癌的患病率。获得的指标与之前研究报告的值吻合良好。所有这些都是在不知道研究个体真实健康状况的情况下完成的。该方法甚至适用于没有明确定义的情况(例如,高血压)。我们相信该方法在许多科学领域有广泛的应用。

https://cdn.ncbi.nlm.nih.gov/pmc/blobs/c333/7807039/46ea6920e950/41598_2020_79548_Fig6_HTML.jpg
https://cdn.ncbi.nlm.nih.gov/pmc/blobs/c333/7807039/7f10735087a4/41598_2020_79548_Fig1_HTML.jpg
https://cdn.ncbi.nlm.nih.gov/pmc/blobs/c333/7807039/d6b91dc9330f/41598_2020_79548_Fig2_HTML.jpg
https://cdn.ncbi.nlm.nih.gov/pmc/blobs/c333/7807039/bef02b2a7b37/41598_2020_79548_Fig3_HTML.jpg
https://cdn.ncbi.nlm.nih.gov/pmc/blobs/c333/7807039/c3f216b069e2/41598_2020_79548_Fig4_HTML.jpg
https://cdn.ncbi.nlm.nih.gov/pmc/blobs/c333/7807039/b2292cf1f36c/41598_2020_79548_Fig5_HTML.jpg
https://cdn.ncbi.nlm.nih.gov/pmc/blobs/c333/7807039/46ea6920e950/41598_2020_79548_Fig6_HTML.jpg

相似文献

1
On the information hidden in a classifier distribution.关于分类器分布中的信息隐藏。
Sci Rep. 2021 Jan 13;11(1):917. doi: 10.1038/s41598-020-79548-9.
2
No need for a gold-standard test: on the mining of diagnostic test performance indices merely based on the distribution of the test value.无需金标准测试:仅基于检测值分布即可挖掘诊断检测性能指标。
BMC Med Res Methodol. 2023 Jan 30;23(1):30. doi: 10.1186/s12874-023-01841-8.
3
More advantages in detecting bone and soft tissue metastases from prostate cancer using F-PSMA PET/CT.使用F-PSMA PET/CT检测前列腺癌骨和软组织转移方面有更多优势。
Hell J Nucl Med. 2019 Jan-Apr;22(1):6-9. doi: 10.1967/s002449910952. Epub 2019 Mar 7.
4
Right putamen and age are the most discriminant features to diagnose Parkinson's disease by using I-FP-CIT brain SPET data by using an artificial neural network classifier, a classification tree (ClT).通过使用人工神经网络分类器(一种分类树,即ClT)对I-FP-CIT脑SPET数据进行分析,右侧壳核和年龄是诊断帕金森病最具判别力的特征。
Hell J Nucl Med. 2017 Sep-Dec;20 Suppl:165.
5
Classifier design for computer-aided diagnosis: effects of finite sample size on the mean performance of classical and neural network classifiers.用于计算机辅助诊断的分类器设计:有限样本量对经典分类器和神经网络分类器平均性能的影响。
Med Phys. 1999 Dec;26(12):2654-68. doi: 10.1118/1.598805.
6
A new optical density granulometry-based descriptor for the classification of prostate histological images using shallow and deep Gaussian processes.一种基于新光学密度粒度分析的描述符,用于使用浅层和深层高斯过程对前列腺组织学图像进行分类。
Comput Methods Programs Biomed. 2019 Sep;178:303-317. doi: 10.1016/j.cmpb.2019.07.003. Epub 2019 Jul 4.
7
A flexible analytic wavelet transform based approach for motor-imagery tasks classification in BCI applications.基于灵活分析小波变换的脑机接口应用中运动想象任务分类方法。
Comput Methods Programs Biomed. 2020 Apr;187:105325. doi: 10.1016/j.cmpb.2020.105325. Epub 2020 Jan 18.
8
[Volume and health outcomes: evidence from systematic reviews and from evaluation of Italian hospital data].[容量与健康结果:来自系统评价和意大利医院数据评估的证据]
Epidemiol Prev. 2013 Mar-Jun;37(2-3 Suppl 2):1-100.
9
Clinical interpretation of prostate-specific antigen values: Type of applied cut-off value exceeds methods bias as the major source of variation.前列腺特异性抗原值的临床解读:应用的截断值类型超过方法偏倚,成为变异的主要来源。
Ann Clin Biochem. 2019 Mar;56(2):259-265. doi: 10.1177/0004563218822665. Epub 2019 Feb 24.
10
Comparison of Artificial Intelligence Techniques to Evaluate Performance of a Classifier for Automatic Grading of Prostate Cancer From Digitized Histopathologic Images.比较人工智能技术评估分类器在从数字化组织病理学图像自动分级前列腺癌方面的性能。
JAMA Netw Open. 2019 Mar 1;2(3):e190442. doi: 10.1001/jamanetworkopen.2019.0442.

引用本文的文献

1
Diagnostic tests performance indices: an overview.诊断测试的性能指标:概述
Biochem Med (Zagreb). 2025 Feb 15;35(1):010101. doi: 10.11613/BM.2025.010101.
2
Data Distribution: Normal or Abnormal?数据分布:正常还是异常?
J Korean Med Sci. 2024 Jan 22;39(3):e35. doi: 10.3346/jkms.2024.39.e35.
3
On the use of receiver operating characteristic curve analysis to determine the most appropriate p value significance threshold.关于使用接收者操作特征曲线分析来确定最合适的 p 值显著性阈值。

本文引用的文献

1
Establishment of reference intervals for serum [-2]proPSA (p2PSA), %p2PSA and prostate health index in healthy men.健康男性血清[-2]前列腺特异性抗原(p2PSA)、p2PSA百分比及前列腺健康指数参考区间的建立。
Onco Targets Ther. 2019 Aug 13;12:6453-6460. doi: 10.2147/OTT.S212340. eCollection 2019.
2
Machine learning for email spam filtering: review, approaches and open research problems.用于电子邮件垃圾邮件过滤的机器学习:综述、方法及开放研究问题。
Heliyon. 2019 Jun 10;5(6):e01802. doi: 10.1016/j.heliyon.2019.e01802. eCollection 2019 Jun.
3
The likelihood ratio and its graphical representation.
J Transl Med. 2024 Jan 4;22(1):16. doi: 10.1186/s12967-023-04827-8.
4
GPTZero Performance in Identifying Artificial Intelligence-Generated Medical Texts: A Preliminary Study.GPTZero 在识别人工智能生成的医学文本方面的性能:一项初步研究。
J Korean Med Sci. 2023 Sep 25;38(38):e319. doi: 10.3346/jkms.2023.38.e319.
5
No need for a gold-standard test: on the mining of diagnostic test performance indices merely based on the distribution of the test value.无需金标准测试:仅基于检测值分布即可挖掘诊断检测性能指标。
BMC Med Res Methodol. 2023 Jan 30;23(1):30. doi: 10.1186/s12874-023-01841-8.
6
The apparent prevalence, the true prevalence.表面患病率,真实患病率。
Biochem Med (Zagreb). 2022 Jun 15;32(2):020101. doi: 10.11613/BM.2022.020101.
7
Determining the SARS-CoV-2 serological immunoassay test performance indices based on the test results frequency distribution.基于检测结果频率分布确定 SARS-CoV-2 血清学免疫分析检测的性能指标。
Biochem Med (Zagreb). 2022 Jun 15;32(2):020705. doi: 10.11613/BM.2022.020705.
8
Molecular diagnostic assays for COVID-19: an overview.用于 COVID-19 的分子诊断检测:概述。
Crit Rev Clin Lab Sci. 2021 Sep;58(6):385-398. doi: 10.1080/10408363.2021.1884640. Epub 2021 Feb 17.
似然比及其图形表示。
Biochem Med (Zagreb). 2019 Jun 15;29(2):020101. doi: 10.11613/BM.2019.020101. Epub 2019 Apr 15.
4
Prostate Cancer Screening: Shared Decision-Making for Screening and Treatment.前列腺癌筛查:筛查与治疗的共同决策
Prim Care. 2019 Mar;46(1):149-155. doi: 10.1016/j.pop.2018.10.012. Epub 2018 Dec 24.
5
The Clinical Relevance of Methods for Handling Inconclusive Medical Test Results: Quantification of Uncertainty in Medical Decision-Making and Screening.处理不确定医学检验结果方法的临床相关性:医学决策与筛查中不确定性的量化
Diagnostics (Basel). 2018 May 9;8(2):32. doi: 10.3390/diagnostics8020032.
6
No change in the prevalence of latent prostate cancer over the last 10 years: a forensic autopsy study in Japan.过去10年日本潜伏性前列腺癌患病率无变化:一项法医尸检研究
Biomed Res. 2017;38(5):307-312. doi: 10.2220/biomedres.38.307.
7
What is a "Diagnostic Test Reference Range" Good for?“诊断测试参考范围”有什么用?
Eur Urol. 2017 Nov;72(5):859-860. doi: 10.1016/j.eururo.2017.05.024. Epub 2017 May 27.
8
Guidelines for the Management of Hypertension.高血压管理指南。
Med Clin North Am. 2017 Jan;101(1):219-227. doi: 10.1016/j.mcna.2016.08.016.
9
On determining the most appropriate test cut-off value: the case of tests with continuous results.关于确定最合适的检测临界值:连续结果检测的情况
Biochem Med (Zagreb). 2016 Oct 15;26(3):297-307. doi: 10.11613/BM.2016.034.
10
Reference intervals: current status, recent developments and future considerations.参考区间:现状、近期进展及未来考量
Biochem Med (Zagreb). 2016;26(1):5-16. doi: 10.11613/BM.2016.001.