University of California (UC) Berkeley-UC San Francisco (UCSF) Joint Medical Program, UC Berkeley School of Public Health and UCSF School of Medicine, Berkeley and San Francisco, California, USA.
Department of Epidemiology, Columbia University Mailman School of Public Health, New York, New York, USA.
Environ Health Perspect. 2021 Jan;129(1):17006. doi: 10.1289/EHP7495. Epub 2021 Jan 27.
Redlining, a racist mortgage appraisal practice of the 1930s, established and exacerbated racial residential segregation boundaries in the United States. Investment risk grades assigned ago through security maps from the Home Owners' Loan Corporation (HOLC) are associated with current sociodemographics and adverse health outcomes. We assessed whether historical HOLC investment grades are associated with 2010 greenspace, a health-promoting neighborhood resource.
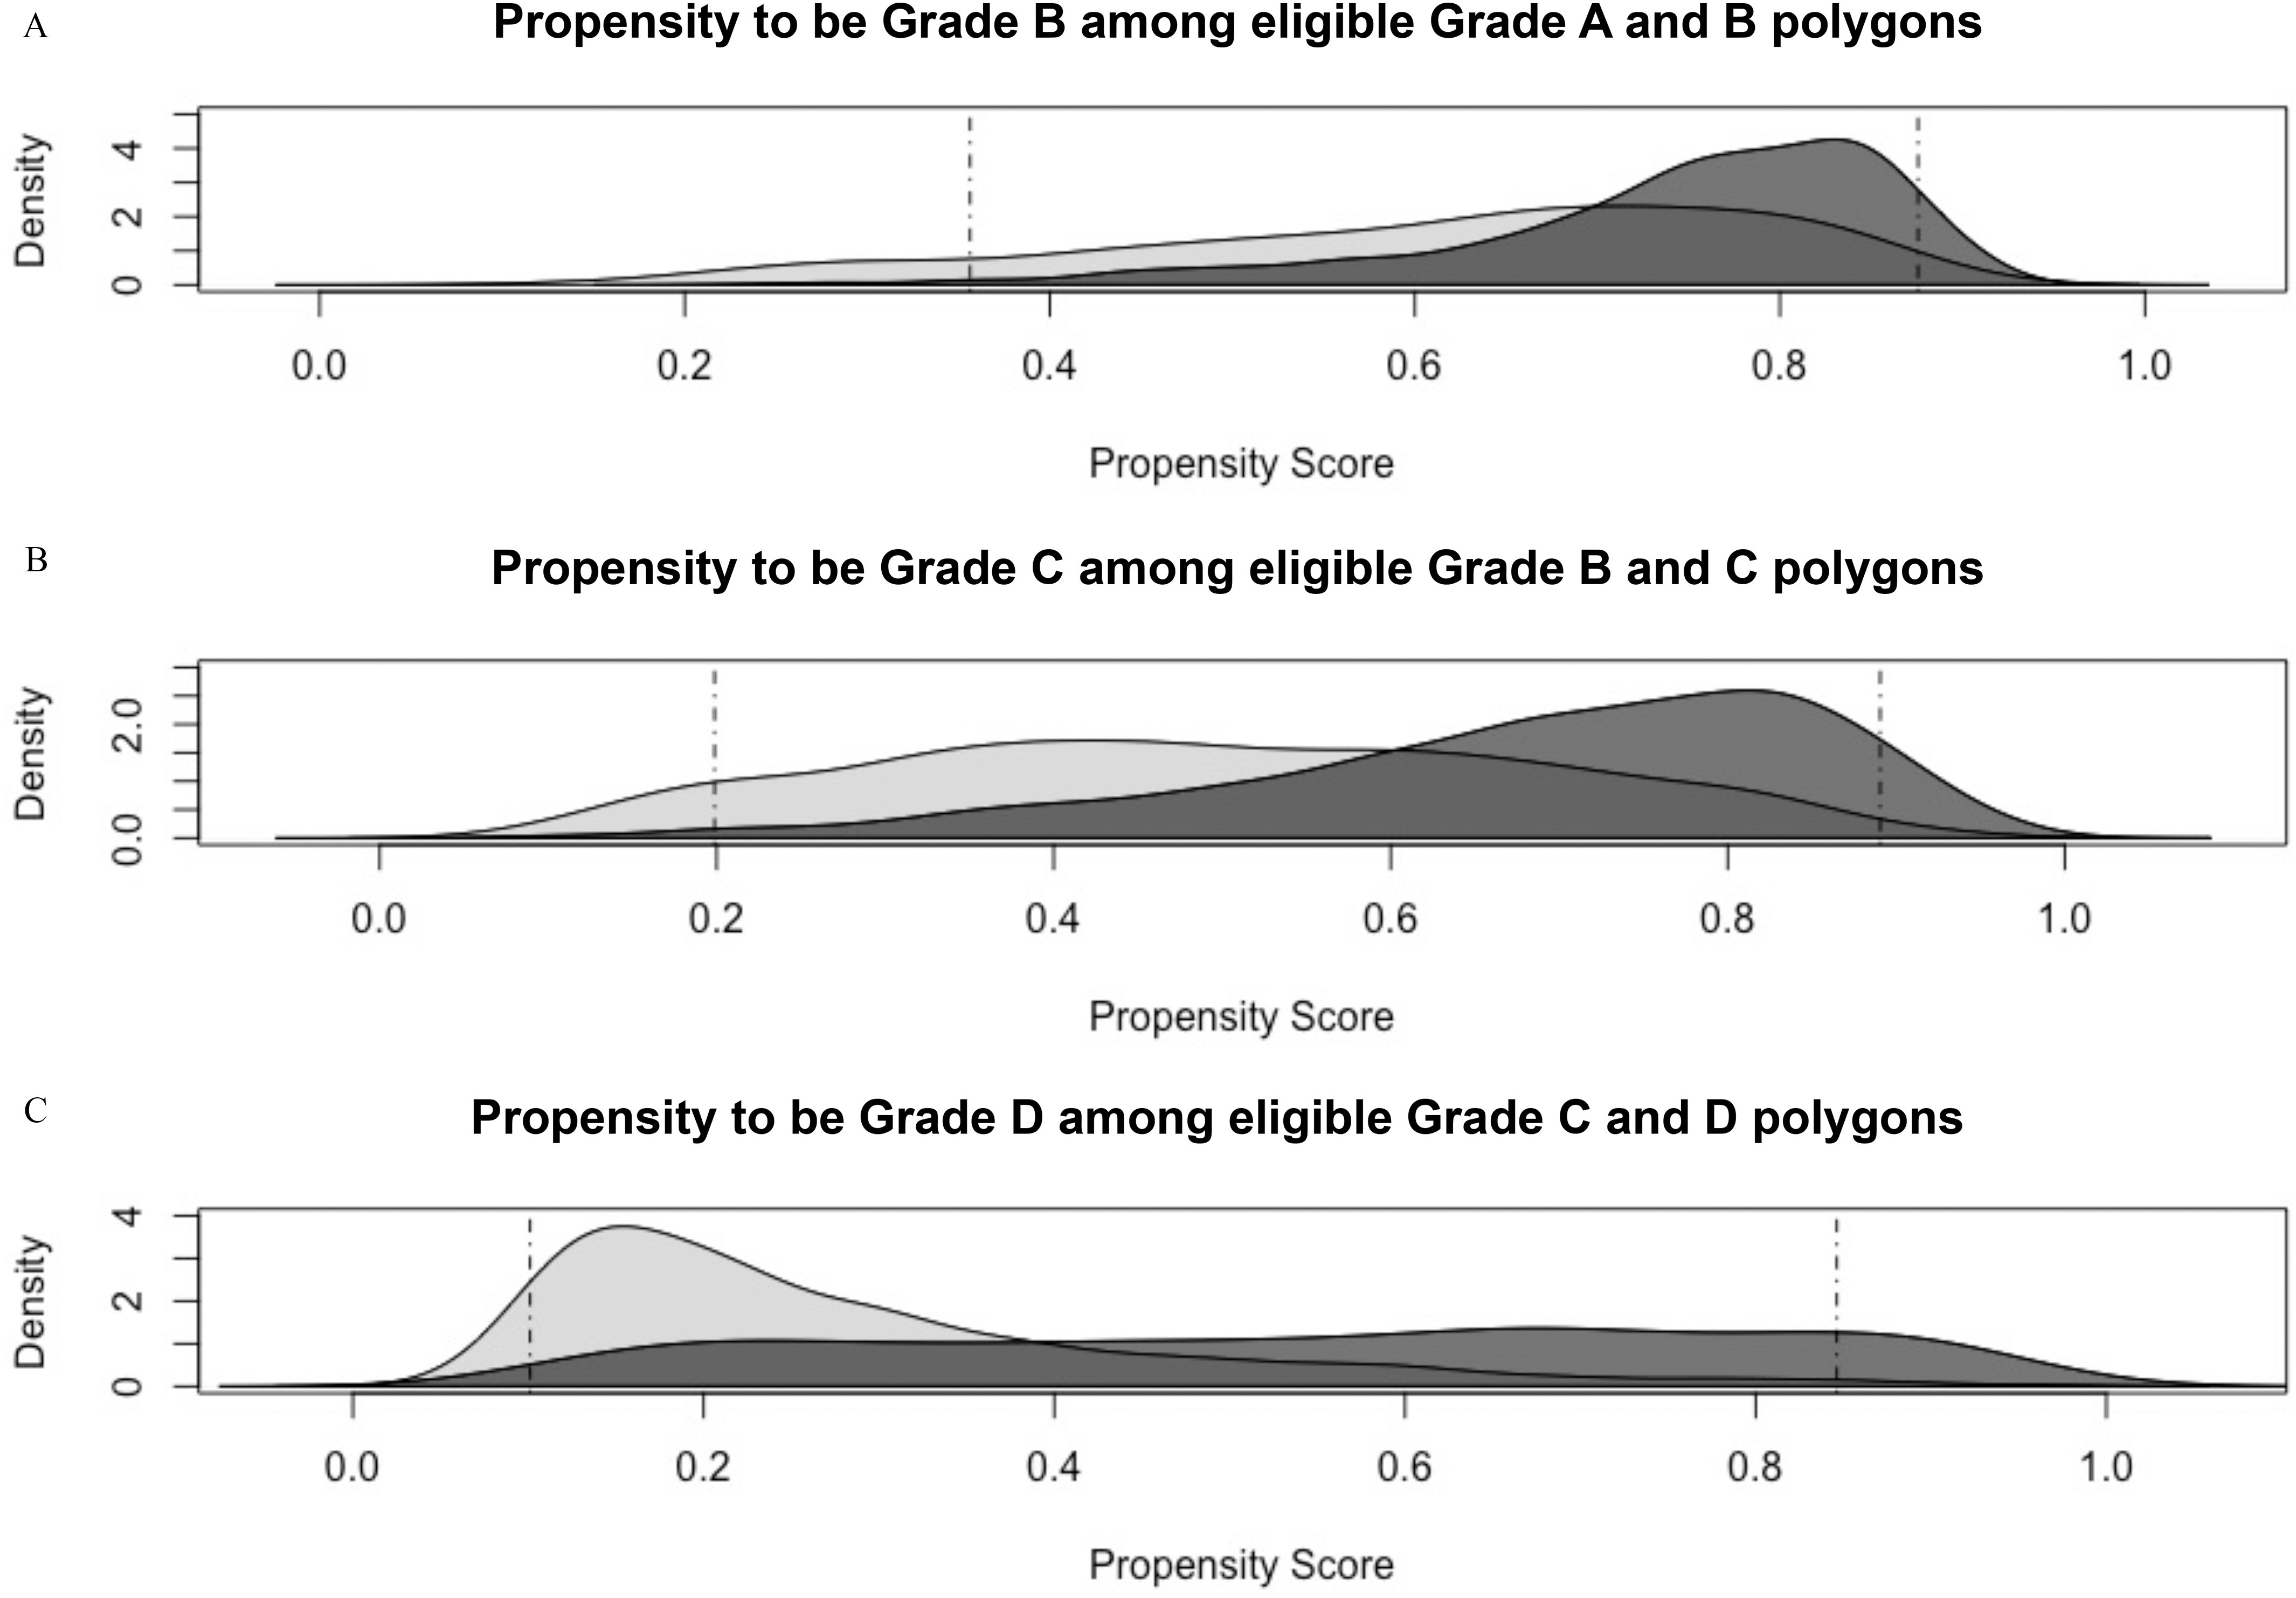
We compared 2010 normalized difference vegetation index (NDVI) across previous HOLC neighborhood grades using propensity score restriction and matching.
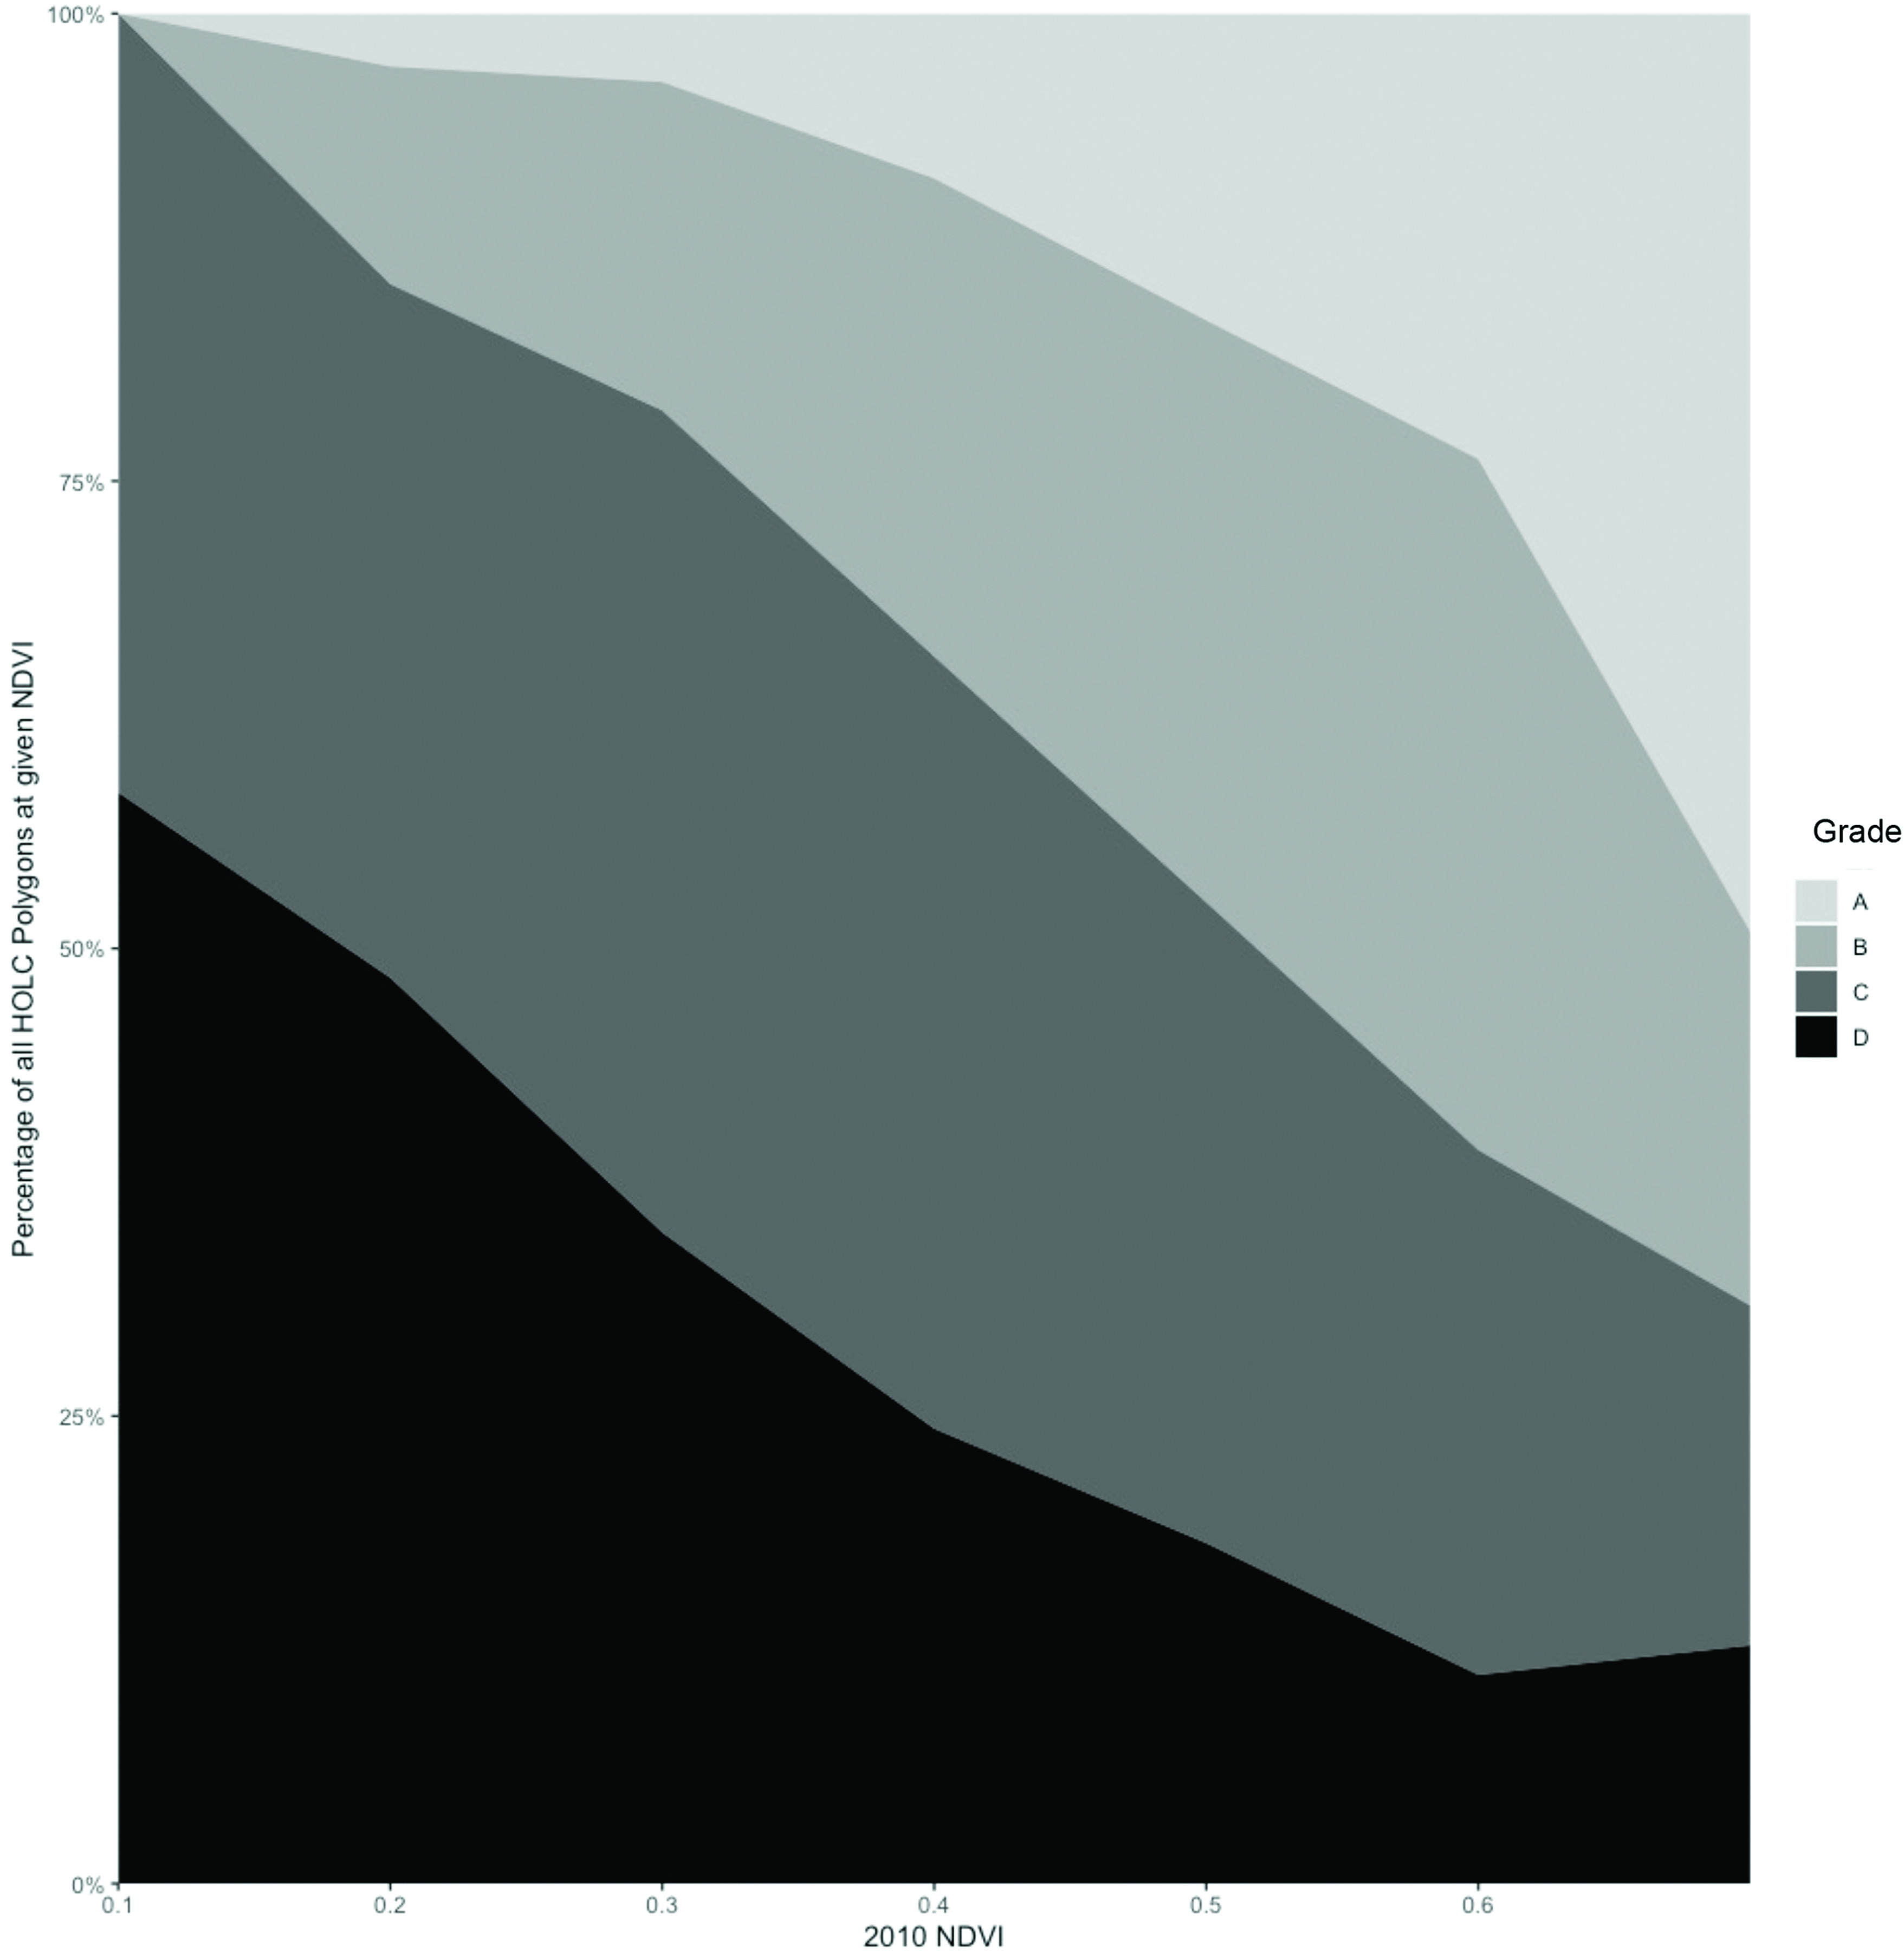
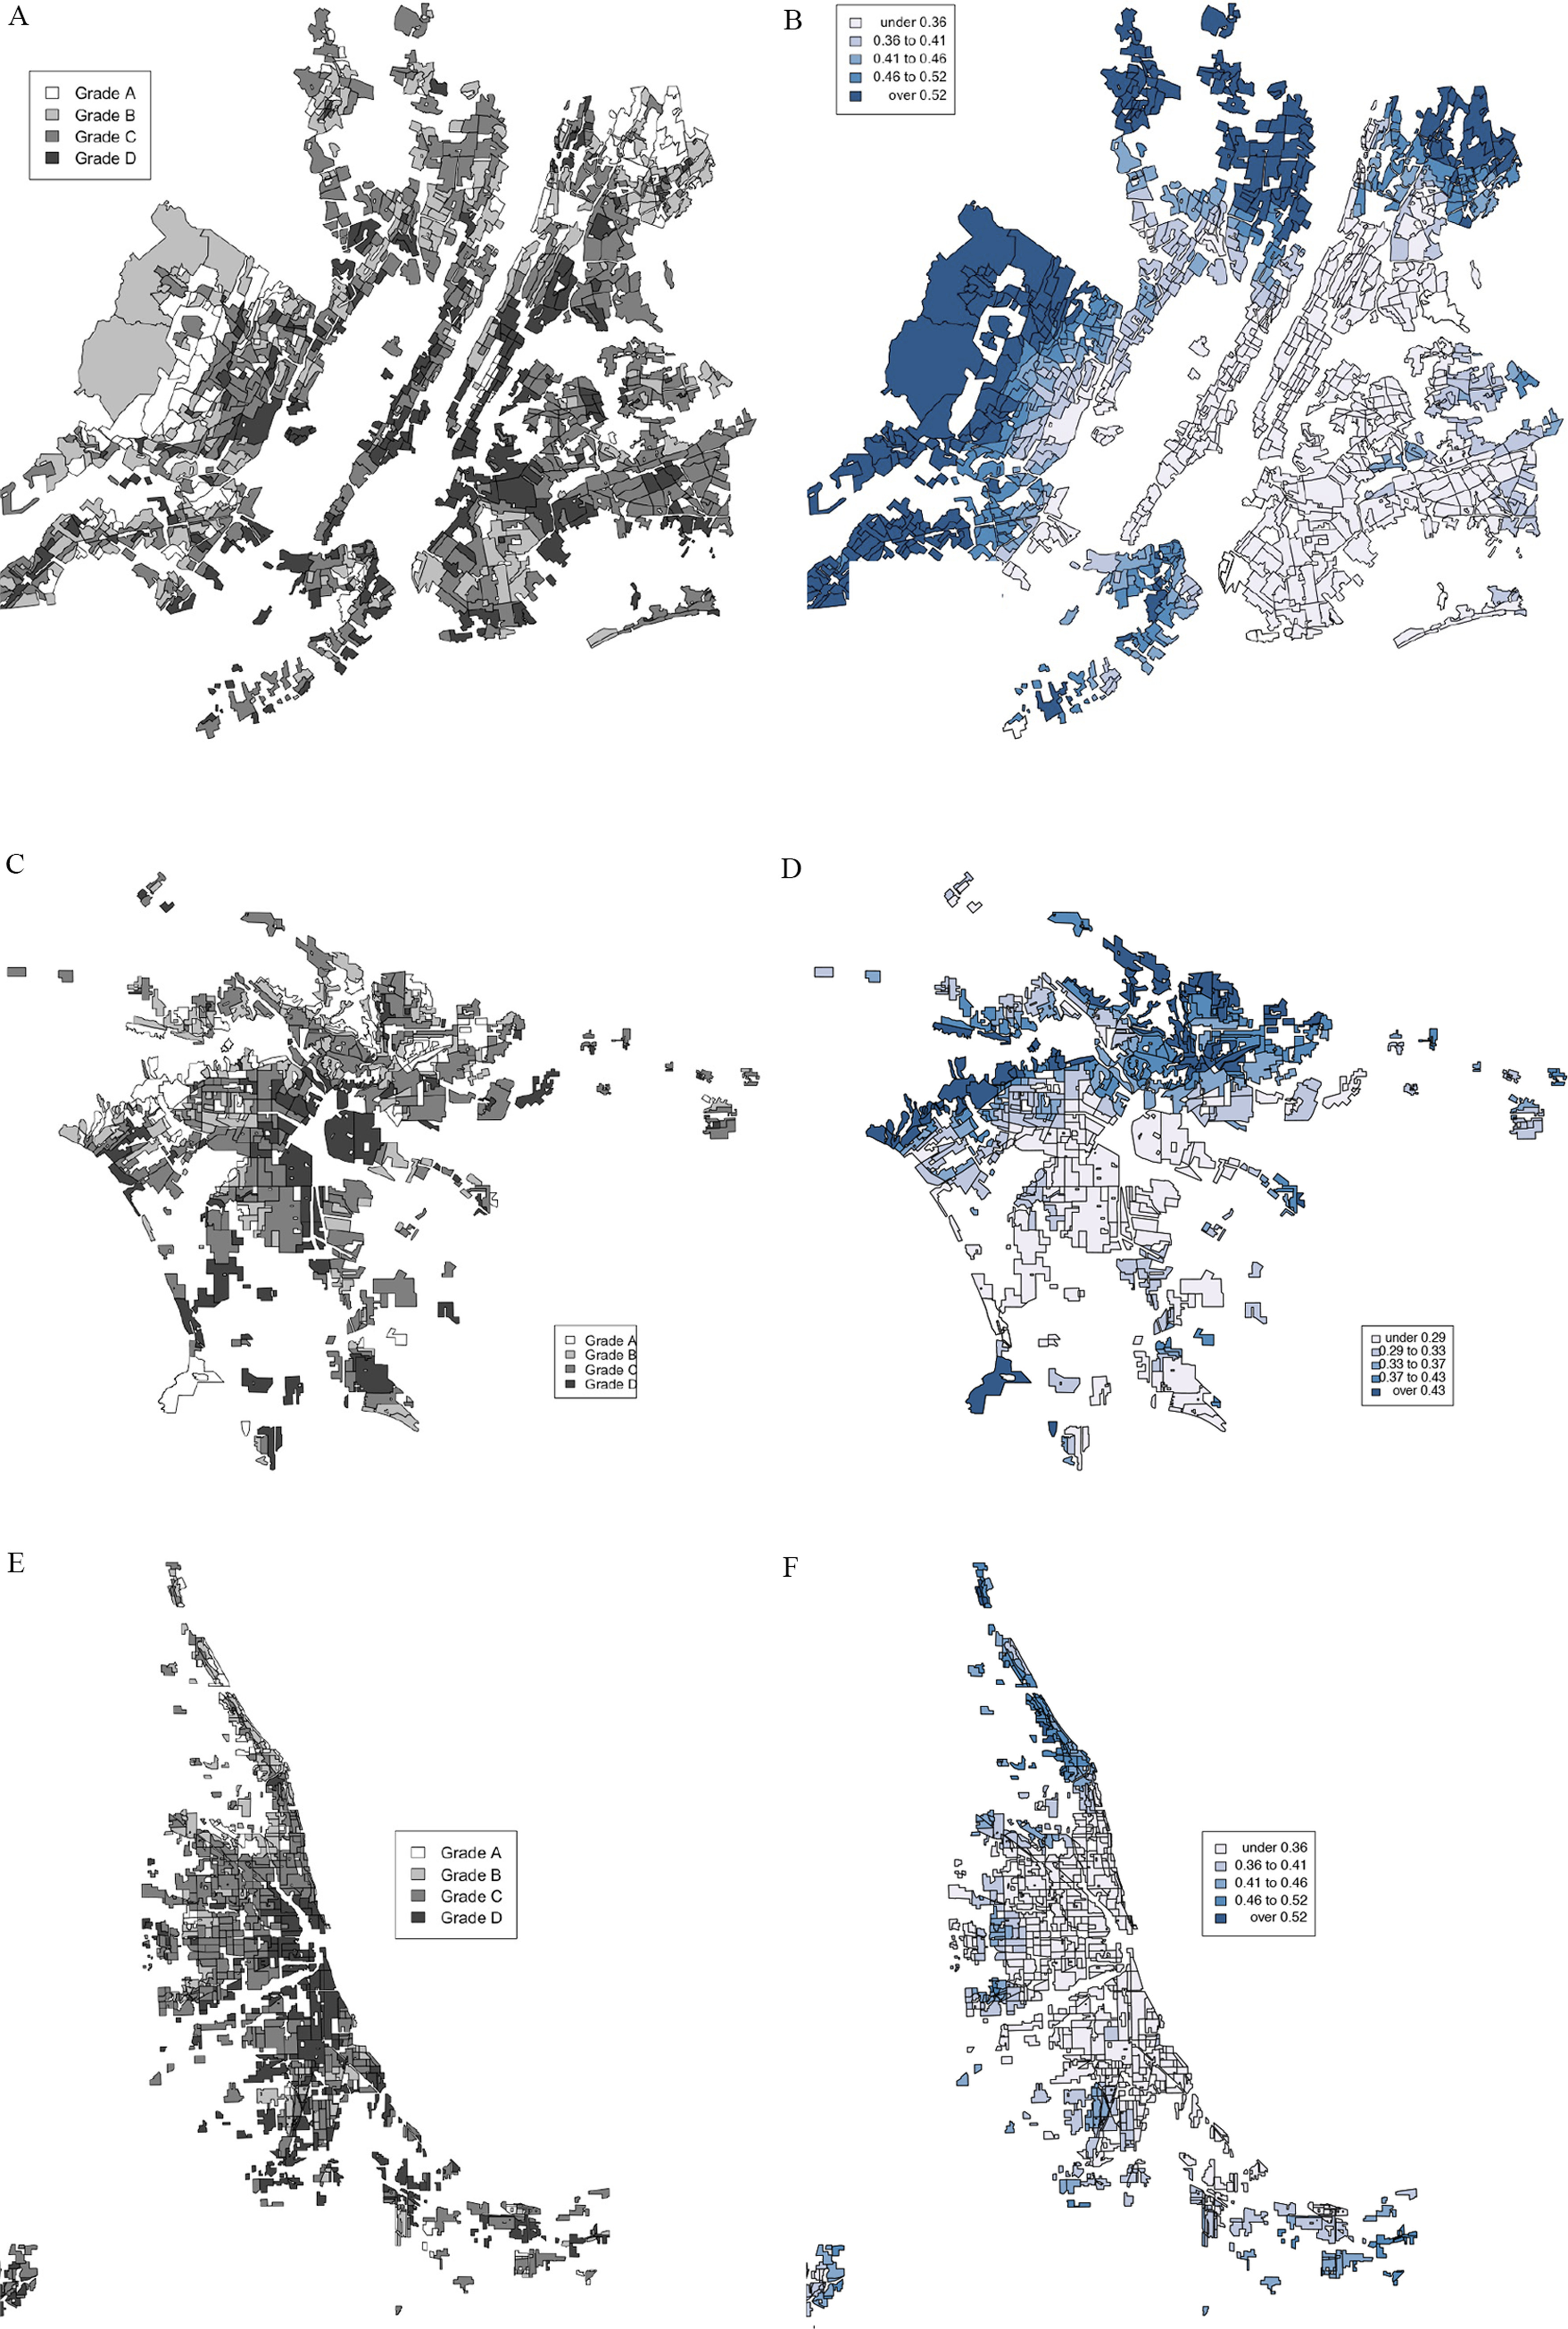
Security map shapefiles were downloaded from the Mapping Inequality Project. Neighborhood investment risk grades included A (best, green), B (blue), C (yellow), and D (hazardous, red, i.e., redlined). We used 2010 satellite imagery to calculate the average NDVI for each HOLC neighborhood. Our main outcomes were 2010 annual average NDVI and summer NDVI. We assigned areal-apportioned 1940 census measures to each HOLC neighborhood. We used propensity score restriction, matching, and targeted maximum likelihood estimation to limit model extrapolation, reduce confounding, and estimate the association between HOLC grade and NDVI for the following comparisons: Grades B vs. A, C vs. B, and D vs. C.
Across 102 urban areas (4,141 HOLC polygons), annual average 2010 NDVI was 0.47 (), 0.43 (), 0.39 (), and 0.36 () in Grades A-D, respectively. In analyses adjusted for current ecoregion and census region, 1940s census measures, and 1940s population density, annual average NDVI values in 2010 were estimated at (95% CI: , ), (95% CI: , ), and (95% CI: , ) for Grades B vs. A, C vs. B, and D vs. C, respectively, in the 1930s.
Estimates adjusted for historical characteristics indicate that neighborhoods assigned worse HOLC grades in the 1930s are associated with reduced present-day greenspace. https://doi.org/10.1289/EHP7495.
“红线”是 20 世纪 30 年代一种带有种族歧视的抵押贷款评估行为,它在美国确立并加剧了种族居住隔离的界限。“房主贷款公司”(HOLC)的安全地图在过去分配的投资风险等级与当前的社会人口统计学和不良健康结果有关。我们评估了历史上 HOLC 的投资等级是否与 2010 年的绿地有关,绿地是一种促进健康的社区资源。
我们通过倾向评分限制和匹配,比较了先前 HOLC 社区等级的 2010 年归一化差异植被指数(NDVI)。
从“映射不平等项目”(Mapping Inequality Project)下载安全地图的 shapefile。社区投资风险等级包括 A(最好,绿色)、B(蓝色)、C(黄色)和 D(危险,红色,即“红线”)。我们使用 2010 年卫星图像计算每个 HOLC 社区的平均 NDVI。我们的主要结果是 2010 年的年平均 NDVI 和夏季 NDVI。我们将 1940 年人口普查的面积分配给每个 HOLC 社区。我们使用倾向评分限制、匹配和有针对性的最大似然估计来限制模型外推、减少混杂因素,并估计以下比较中 HOLC 等级与 NDVI 之间的关联:B 级与 A 级、C 级与 B 级和 D 级与 C 级。
在 102 个城市(4141 个 HOLC 多边形)中,2010 年的年平均 NDVI 分别为 A 级的 0.47()、B 级的 0.43()、C 级的 0.39()和 D 级的 0.36()。在调整了当前生态区和普查区、20 世纪 40 年代的普查数据以及 20 世纪 40 年代的人口密度的分析中,B 级与 A 级、C 级与 B 级和 D 级与 C 级的 2010 年的年平均 NDVI 值估计值分别为 (95% CI:,)、(95% CI:,)和 (95% CI:,)。
根据历史特征进行调整的估计表明,在 20 世纪 30 年代被分配到较差 HOLC 等级的社区与现在绿地的减少有关。https://doi.org/10.1289/EHP7495。