Department of Psychology, College of Charleston, Charleston, SC, USA.
Food and Agriculture Organization, Dar es Salam, Tanzania, & Department of Veterinary Tropical Diseases, University of Pretoria, South Africa.
Methods. 2021 Nov;195:72-76. doi: 10.1016/j.ymeth.2021.03.010. Epub 2021 Mar 18.
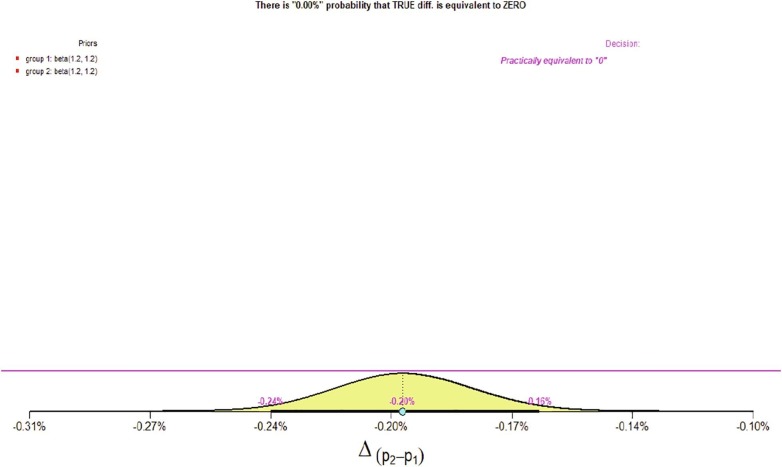
The test positivity (TP) rate has emerged as an important metric for gauging the illness burden due to COVID-19. Given the importance of COVID-19 TP rates for understanding COVID-related morbidity, researchers and clinicians have become increasingly interested in comparing TP rates across countries. The statistical methods for performing such comparisons fall into two general categories: frequentist tests and Bayesian methods. Using data from Our World in Data (ourworldindata.org), we performed comparisons for two prototypical yet disparate pairs of countries: Bolivia versus the United States (large vs. small-to-moderate TP rates), and South Korea vs. Uruguay (two very small TP rates of similar magnitude). Three different statistical procedures were used: two frequentist tests (an asymptotic z-test and the 'N-1' chi-square test), and a Bayesian method for comparing two proportions (TP rates are proportions). Results indicated that for the case of large vs. small-to-moderate TP rates (Bolivia versus the United States), the frequentist and Bayesian approaches both indicated that the two rates were substantially different. When the TP rates were very small and of similar magnitude (values of 0.009 and 0.007 for South Korea and Uruguay, respectively), the frequentist tests indicated a highly significant contrast, despite the apparent trivial amount by which the two rates differ. The Bayesian method, in comparison, suggested that the TP rates were practically equivalent-a finding that seems more consistent with the observed data. When TP rates are highly similar in magnitude, frequentist tests can lead to erroneous interpretations. A Bayesian approach, on the other hand, can help ensure more accurate inferences and thereby avoid potential decision errors that could lead to costly public health and policy-related consequences.
检测阳性率(TP)已成为衡量 COVID-19 疾病负担的重要指标。鉴于 COVID-19 的 TP 率对于了解与 COVID 相关的发病率至关重要,研究人员和临床医生越来越有兴趣比较各国的 TP 率。用于进行此类比较的统计方法分为两类:频率派检验和贝叶斯方法。我们使用来自 Our World in Data(ourworldindata.org)的数据,对两个典型但截然不同的国家对进行了比较:玻利维亚与美国(TP 率高与中小)和韩国与乌拉圭(TP 率非常低且相似)。使用了三种不同的统计程序:两种频率派检验(渐近 z 检验和“N-1”卡方检验),以及一种用于比较两个比例的贝叶斯方法(TP 率是比例)。结果表明,对于高与中小 TP 率的情况(玻利维亚与美国),频率派和贝叶斯方法都表明这两个率有很大的不同。当 TP 率非常低且相似时(韩国和乌拉圭分别为 0.009 和 0.007),频率派检验表明存在高度显著的对比,尽管这两个率的差异看似微不足道。相比之下,贝叶斯方法表明 TP 率实际上是等效的——这一发现似乎更符合观察到的数据。当 TP 率在幅度上非常相似时,频率派检验可能导致错误的解释。另一方面,贝叶斯方法可以帮助确保更准确的推断,从而避免可能导致昂贵的公共卫生和政策相关后果的潜在决策错误。