Liu Jiajun, Wang Long, Zhu Yun, Lin Che-Jen, Jang Carey, Wang Shuxiao, Xing Jia, Yu Bin, Xu Hui, Pan Yuzhou
Guangdong Provincial Key Laboratory of Atmospheric Environment and Pollution Control, College of Environment and Energy, South China University of Technology, Guangzhou Higher Education Mega Center, Guangzhou 510006, China.
Department of Civil and Environmental Engineering, Lamar University, Beaumont, Texas 77710, USA.
Front Environ Sci Eng. 2018;13(1). doi: 10.1007/s11783-019-1087-6.
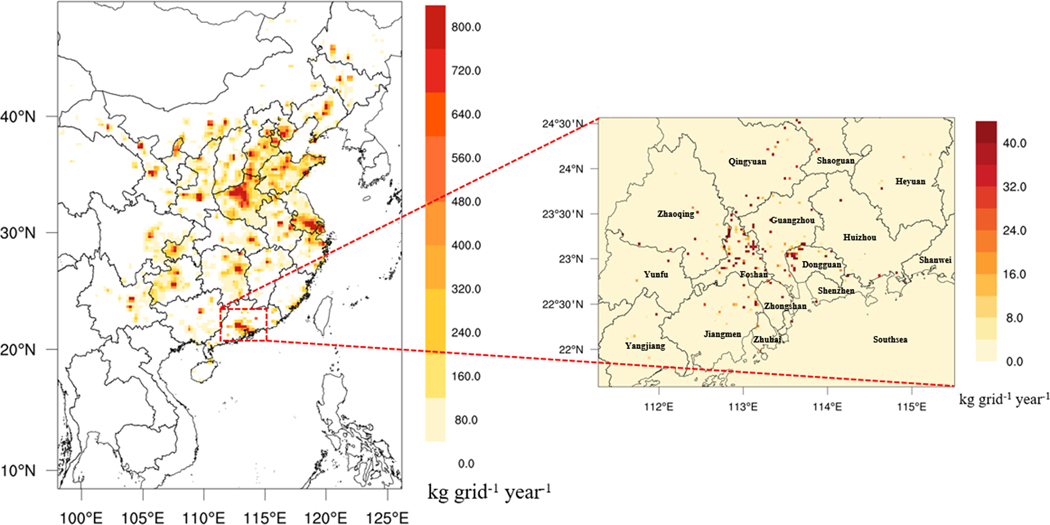
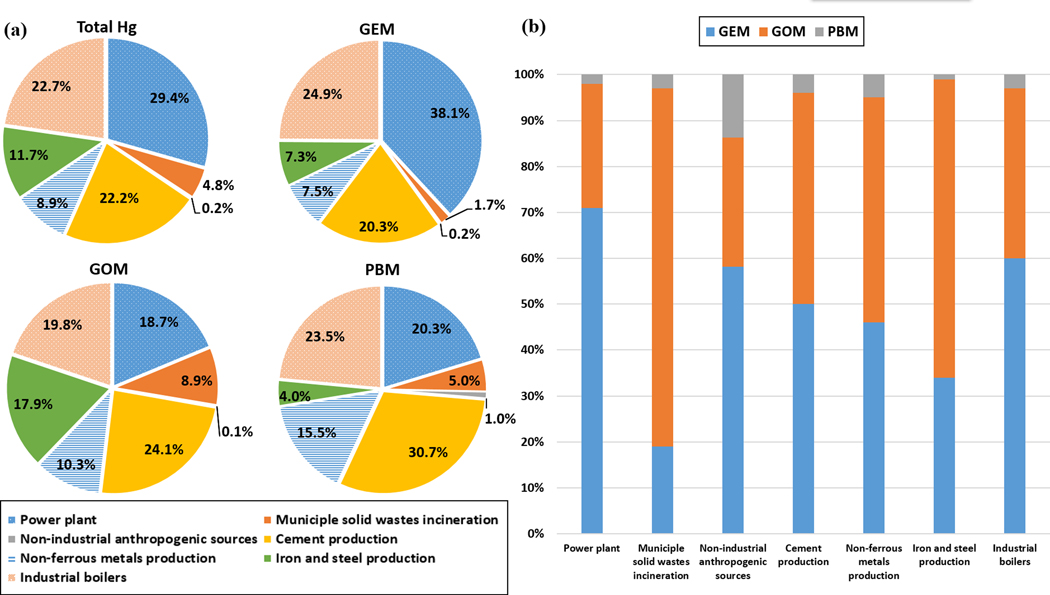
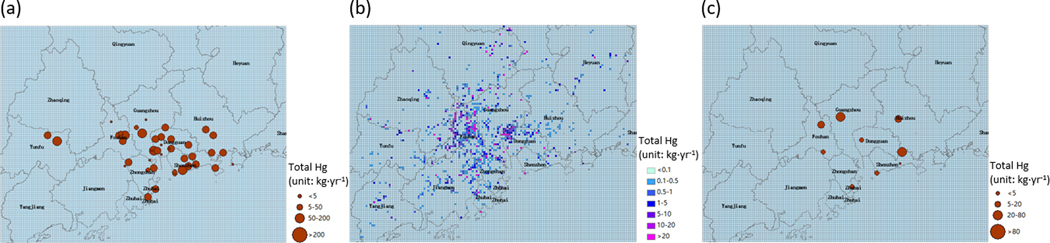
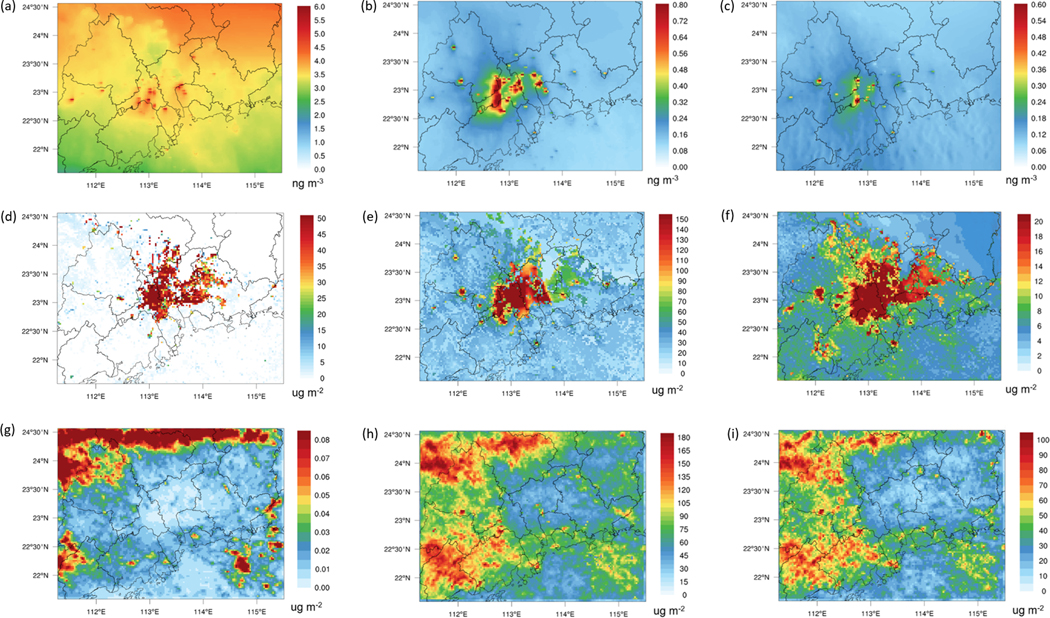
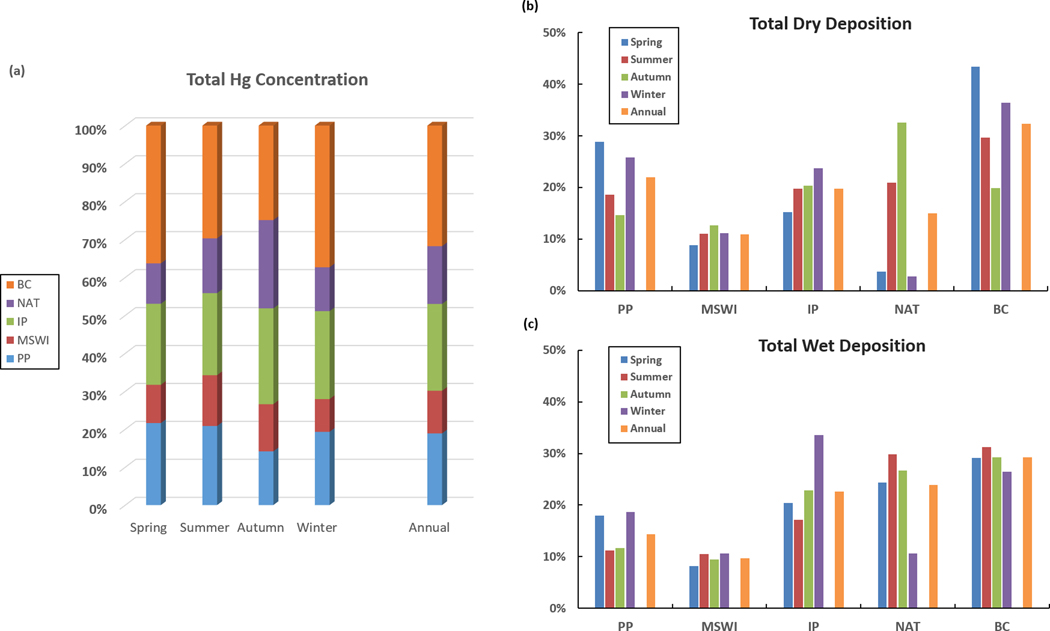
We used CMAQ-Hg to simulate mercury pollution and identify main sources in the Pearl River Delta (PRD) with updated local emission inventory and latest regional and global emissions. The total anthropogenic mercury emissions in the PRD for 2014 were 11,939.6 kg. Power plants and industrial boilers were dominant sectors, responsible for 29.4 and 22.7%. We first compared model predictions and observations and the results showed a good performance. Then five scenarios with power plants (PP), municipal solid waste incineration (MSWI), industrial point sources (IP), natural sources (NAT), and boundary conditions (BCs) zeroed out separately were simulated and compared with the base case. BCs was responsible for over 30% of annual average mercury concentration and total deposition while NAT contributed around 15%. Among the anthropogenic sources, IP (22.9%) was dominant with a contribution over 20.0% and PP (18.9%) and MSWI (11.2%) ranked second and third. Results also showed that power plants were the most important emission sources in the central PRD, where the ultra-low emission for thermal power units need to be strengthened. In the northern and western PRD, cement and metal productions were priorities for mercury control. The fast growth of municipal solid waste incineration were also a key factor in the core areas. In addition, a coordinated regional mercury emission control was important for effectively controlling pollution. In the future, mercury emissions will decrease as control measures are strengthened, more attention should be paid to mercury deposition around the large point sources as high levels of pollution are observed.
我们使用CMAQ-Hg模型,结合更新后的本地排放清单以及最新的区域和全球排放数据,对珠江三角洲(PRD)的汞污染进行模拟,并确定主要来源。2014年珠江三角洲地区人为汞排放总量为11,939.6千克。发电厂和工业锅炉是主要排放部门,分别占29.4%和22.7%。我们首先比较了模型预测结果与观测数据,结果显示模型表现良好。然后分别模拟了发电厂(PP)、城市固体废弃物焚烧(MSWI)、工业点源(IP)、自然源(NAT)和边界条件(BCs)为零的五种情景,并与基准情景进行比较。边界条件对年平均汞浓度和总沉降的贡献率超过30%,而自然源的贡献率约为15%。在人为源中,工业点源(22.9%)占主导地位,贡献率超过20.0%,发电厂(18.9%)和城市固体废弃物焚烧(11.2%)分别位列第二和第三。结果还表明,发电厂是珠江三角洲中部最重要的排放源,需要加强火力发电机组的超低排放。在珠江三角洲北部和西部,水泥和金属生产是汞控制的重点。城市固体废弃物焚烧的快速增长也是核心区域的一个关键因素。此外,区域汞排放的协同控制对于有效控制污染至关重要。未来,随着控制措施的加强汞排放将减少,但由于观测到高污染水平,应更加关注大型点源周围的汞沉降。