Children's Health and Environment Programme, Child Health Research Centre, University of Queensland, Brisbane, QLD 4101, Australia.
Int J Environ Res Public Health. 2021 Mar 15;18(6):3010. doi: 10.3390/ijerph18063010.
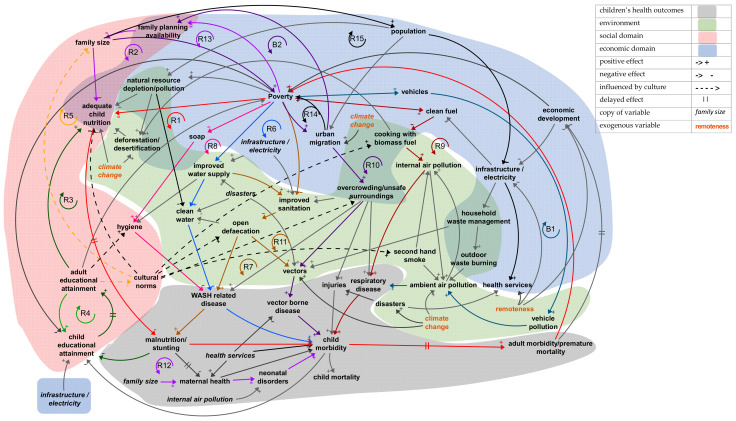
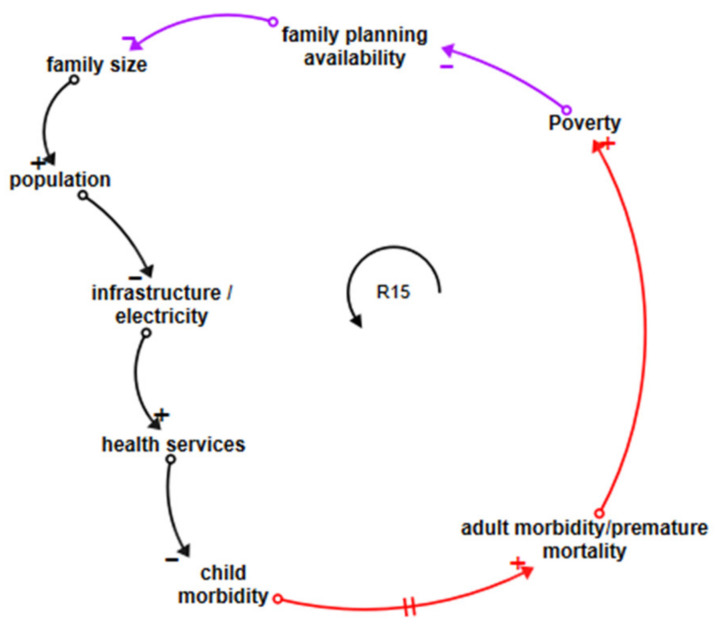
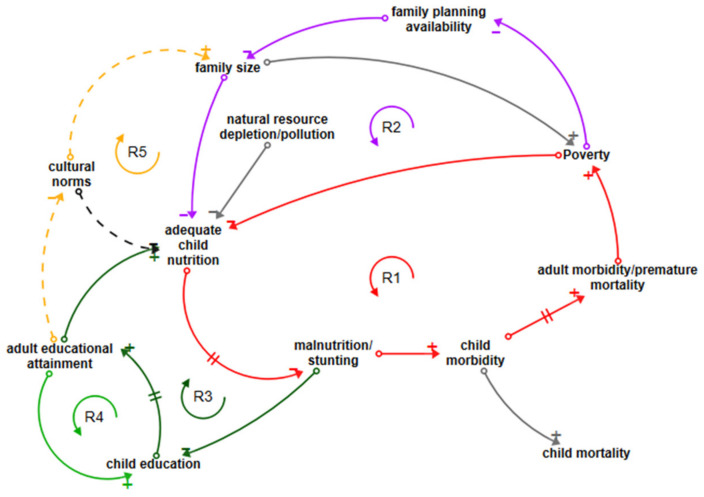
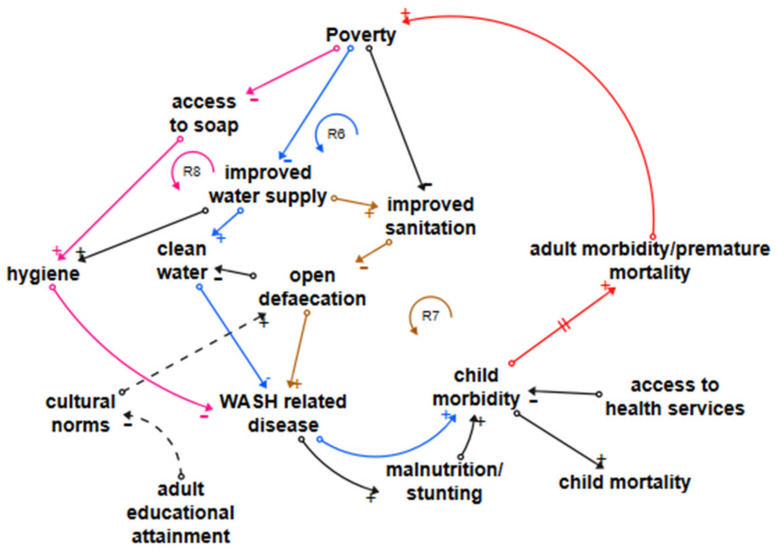
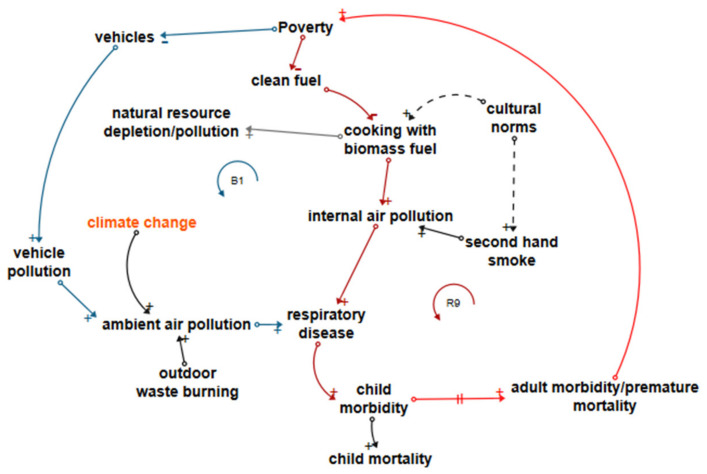
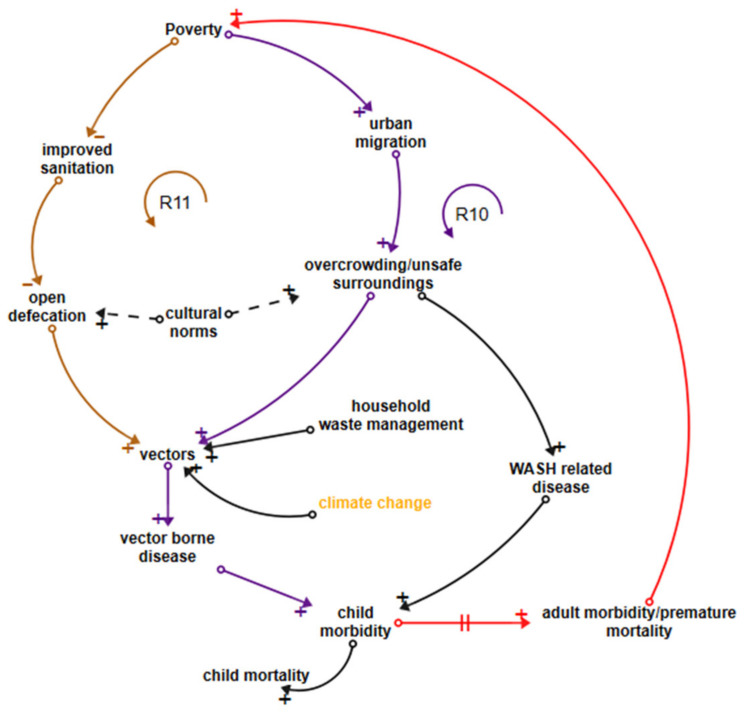
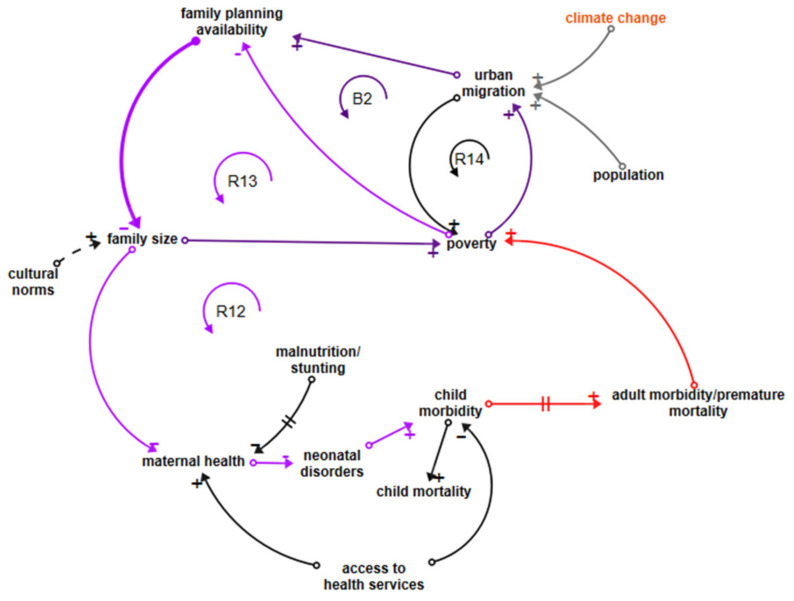
Least developed countries (LDCs) are home to over a billion people throughout Africa, Asia-Pacific, and the Caribbean. The people who live in LDCs represent just 13% of the global population but 40% of its growth rate. Characterised by low incomes and low education levels, high proportions of the population practising subsistence living, inadequate infrastructure, and lack of economic diversity and resilience, LDCs face serious health, environmental, social, and economic challenges. Many communities in LDCs have very limited access to adequate sanitation, safe water, and clean cooking fuel. LDCs are environmentally vulnerable; facing depletion of natural resources, the effects of unsustainable urbanization, and the impacts of climate change, leaving them unable to safeguard their children's lifetime health and wellbeing. This paper reviews and describes the complexity of the causal relationships between children's health and its environmental, social, and economic influences in LDCs using a causal loop diagram (CLD). The results identify some critical feedbacks between poverty, family size, population growth, children's and adults' health, inadequate water, sanitation and hygiene (WASH), air pollution, and education levels in LDCs and suggest leverage points for potential interventions. A CLD can also be a starting point for quantitative systems science approaches in the field, which can predict and compare the effects of interventions.
最不发达国家(LDCs)在非洲、亚太地区和加勒比地区拥有超过 10 亿人口。这些国家的人口仅占全球人口的 13%,但增长率却占全球的 40%。最不发达国家的特点是收入低、教育水平低、大量人口从事自给性生计、基础设施不足以及经济多样性和弹性缺乏,这些都使其面临严重的健康、环境、社会和经济挑战。许多最不发达国家的社区获得充足的卫生设施、安全饮用水和清洁烹饪燃料的机会非常有限。最不发达国家在环境方面非常脆弱,面临自然资源枯竭、不可持续城市化的影响以及气候变化的冲击,使其无法保障儿童的终生健康和福祉。本文使用因果关系图(CLD),综述并描述了最不发达国家儿童健康与其环境、社会和经济影响之间的因果关系的复杂性。研究结果确定了一些最不发达国家中贫困、家庭规模、人口增长、儿童和成人健康、水、环境卫生和个人卫生(WASH)不足、空气污染和教育水平之间的一些关键反馈,并提出了潜在干预措施的杠杆点。因果关系图也可以作为该领域定量系统科学方法的起点,可用于预测和比较干预措施的效果。