Kumar Ayush, Netzel Rudolf, Burch Michael, Weiskopf Daniel, Mueller Klaus
Stony Brook University, USA.
University of Stuttgart, Germany.
J Eye Mov Res. 2018 Feb 14;10(5). doi: 10.16910/jemr.10.5.10.
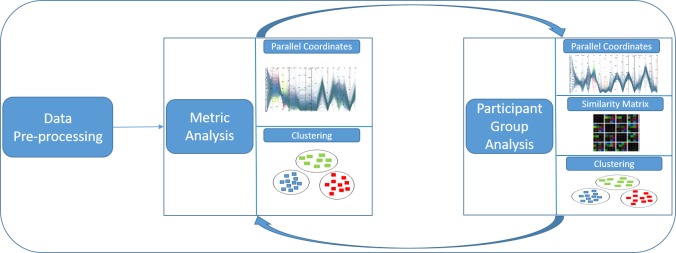
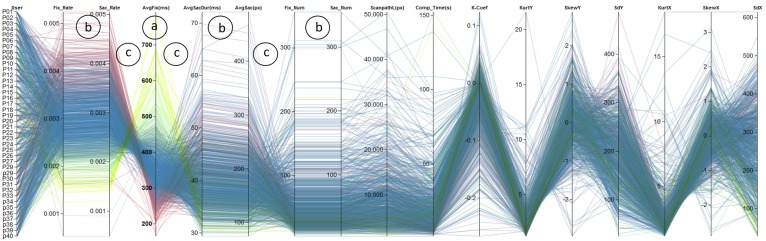
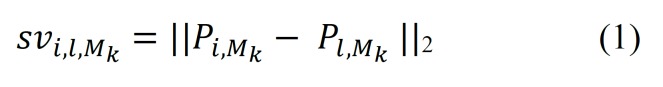
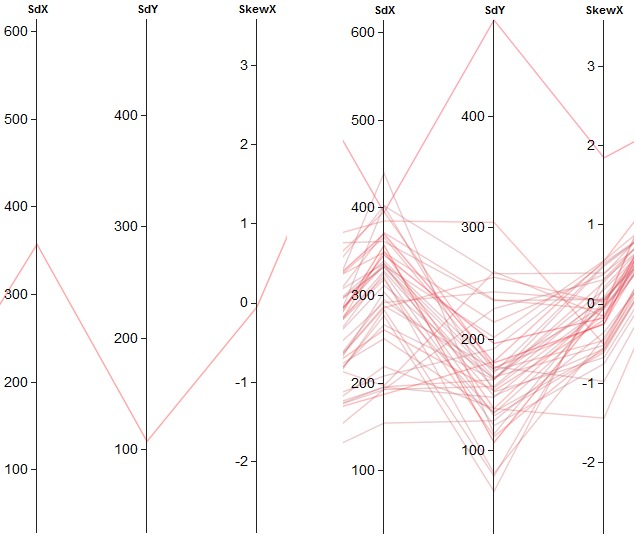
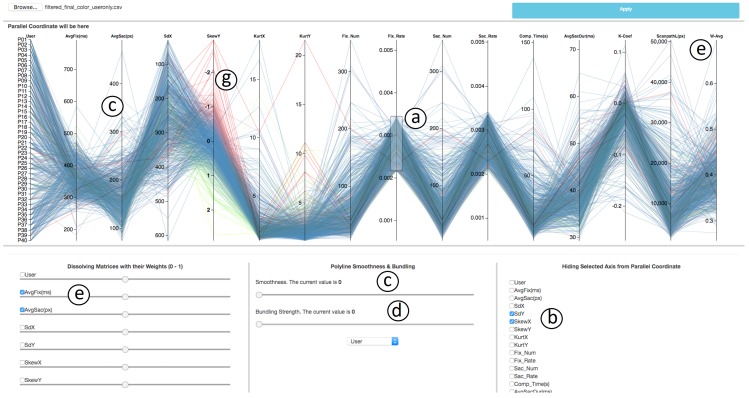
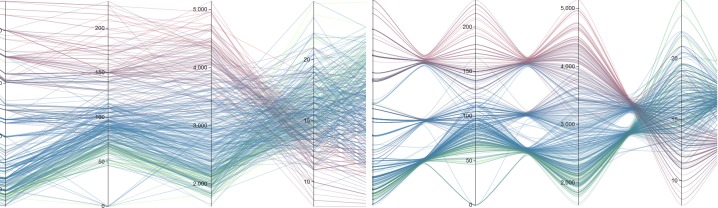
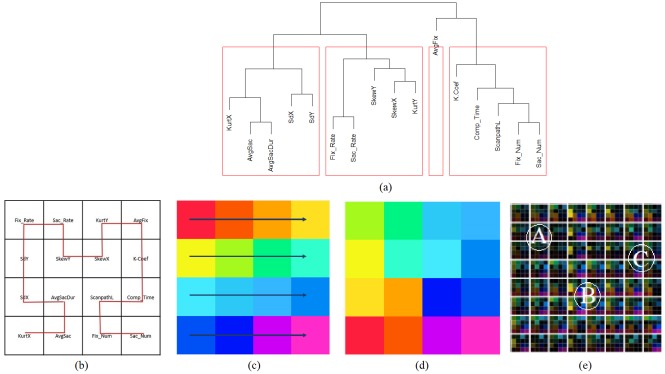
We present an algorithmic and visual grouping of participants and eye-tracking metrics derived from recorded eye-tracking data. Our method utilizes two well-established visualization concepts. First, parallel coordinates are used to provide an overview of the used metrics, their interactions, and similarities, which helps select suitable metrics that describe characteristics of the eye-tracking data. Furthermore, parallel coordinates plots enable an analyst to test the effects of creating a combination of a subset of metrics resulting in a newly derived eye-tracking metric. Second, a similarity matrix visualization is used to visually represent the affine combination of metrics utilizing an algorithmic grouping of subjects that leads to distinct visual groups of similar behavior. To keep the diagrams of the matrix visualization simple and understandable, we visually encode our eyetracking data into the cells of a similarity matrix of participants. The algorithmic grouping is performed with a clustering based on the affine combination of metrics, which is also the basis for the similarity value computation of the similarity matrix. To illustrate the usefulness of our visualization, we applied it to an eye-tracking data set involving the reading behavior of metro maps of up to 40 participants. Finally, we discuss limitations and scalability issues of the approach focusing on visual and perceptual issues.
我们展示了一种对参与者进行算法和可视化分组以及从记录的眼动追踪数据中得出的眼动追踪指标。我们的方法利用了两个成熟的可视化概念。首先,平行坐标用于提供所用指标、它们的相互作用和相似性的概述,这有助于选择描述眼动追踪数据特征的合适指标。此外,平行坐标图使分析师能够测试创建指标子集的组合所产生的新衍生眼动追踪指标的效果。其次,相似性矩阵可视化用于通过对受试者进行算法分组来直观地表示指标的仿射组合,从而形成具有相似行为的不同视觉组。为了使矩阵可视化的图表简单易懂,我们将眼动追踪数据直观地编码到参与者相似性矩阵的单元格中。算法分组是基于指标的仿射组合进行聚类,这也是相似性矩阵相似性值计算的基础。为了说明我们可视化的有用性,我们将其应用于一个涉及多达40名参与者地铁线路图阅读行为的眼动追踪数据集。最后,我们讨论了该方法在视觉和感知问题方面的局限性和可扩展性问题。