• 文献检索
  • 文档翻译
  • 深度研究
  • 学术资讯
  • Suppr Zotero 插件Zotero 插件
  • 邀请有礼
  • 套餐&价格
  • 历史记录
应用&插件
Suppr Zotero 插件Zotero 插件浏览器插件Mac 客户端Windows 客户端微信小程序
定价
高级版会员购买积分包购买API积分包
服务
文献检索文档翻译深度研究API 文档MCP 服务
关于我们
关于 Suppr公司介绍联系我们用户协议隐私条款
关注我们

Suppr 超能文献

核心技术专利:CN118964589B侵权必究
粤ICP备2023148730 号-1Suppr @ 2026

文献检索

告别复杂PubMed语法,用中文像聊天一样搜索,搜遍4000万医学文献。AI智能推荐,让科研检索更轻松。

立即免费搜索

文件翻译

保留排版,准确专业,支持PDF/Word/PPT等文件格式,支持 12+语言互译。

免费翻译文档

深度研究

AI帮你快速写综述,25分钟生成高质量综述,智能提取关键信息,辅助科研写作。

立即免费体验

基于数据驱动方法的遥感水质指数估算:以印度北方邦的卡利河为例

Remote sensing-based water quality index estimation using data-driven approaches: a case study of the Kali River in Uttar Pradesh, India.

作者信息

Said Saif, Khan Shadab Ali

机构信息

Civil Engineering Department, Aligarh Muslim University, (AMU), Aligarh, India.

出版信息

Environ Dev Sustain. 2021;23(12):18252-18277. doi: 10.1007/s10668-021-01437-6. Epub 2021 Apr 21.

DOI:10.1007/s10668-021-01437-6
PMID:33897276
原文链接:https://pmc.ncbi.nlm.nih.gov/articles/PMC8058146/
Abstract

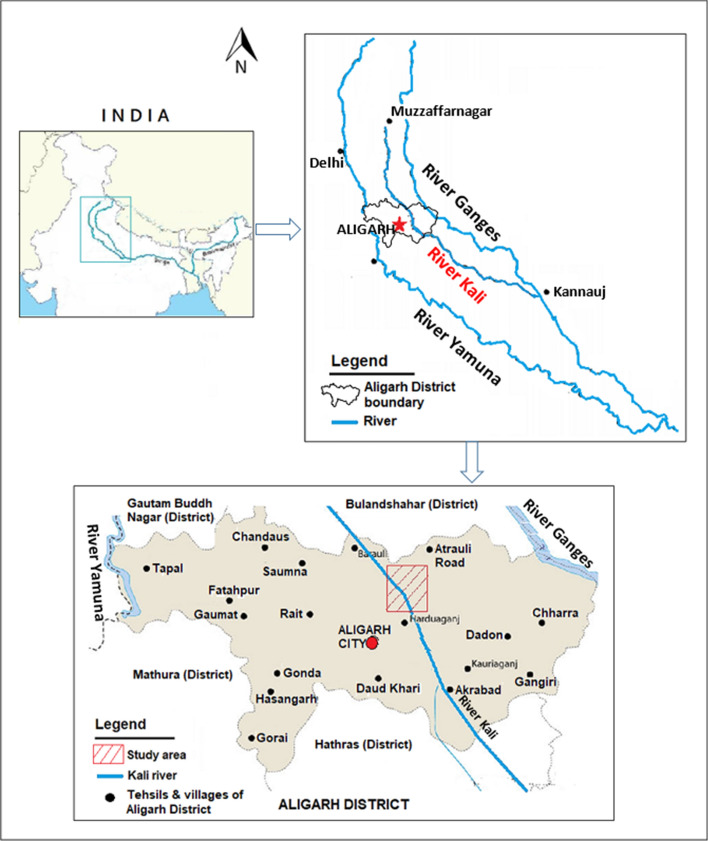
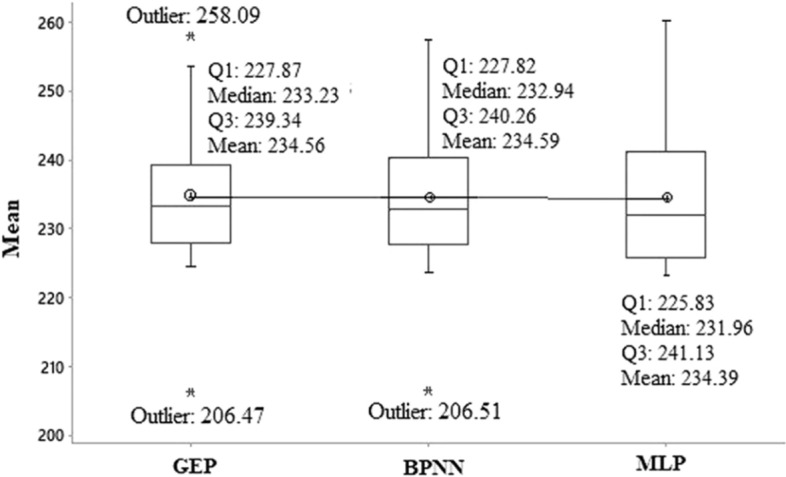
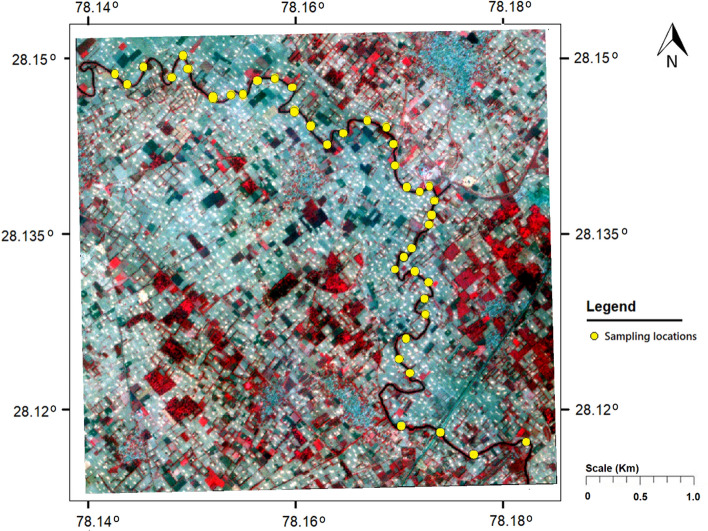
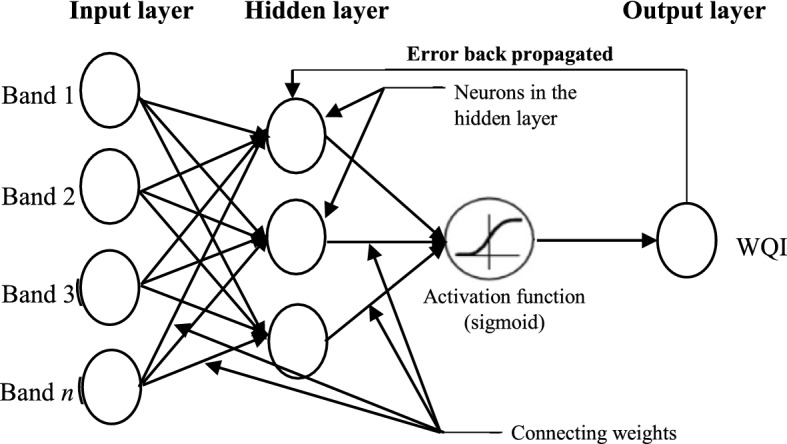
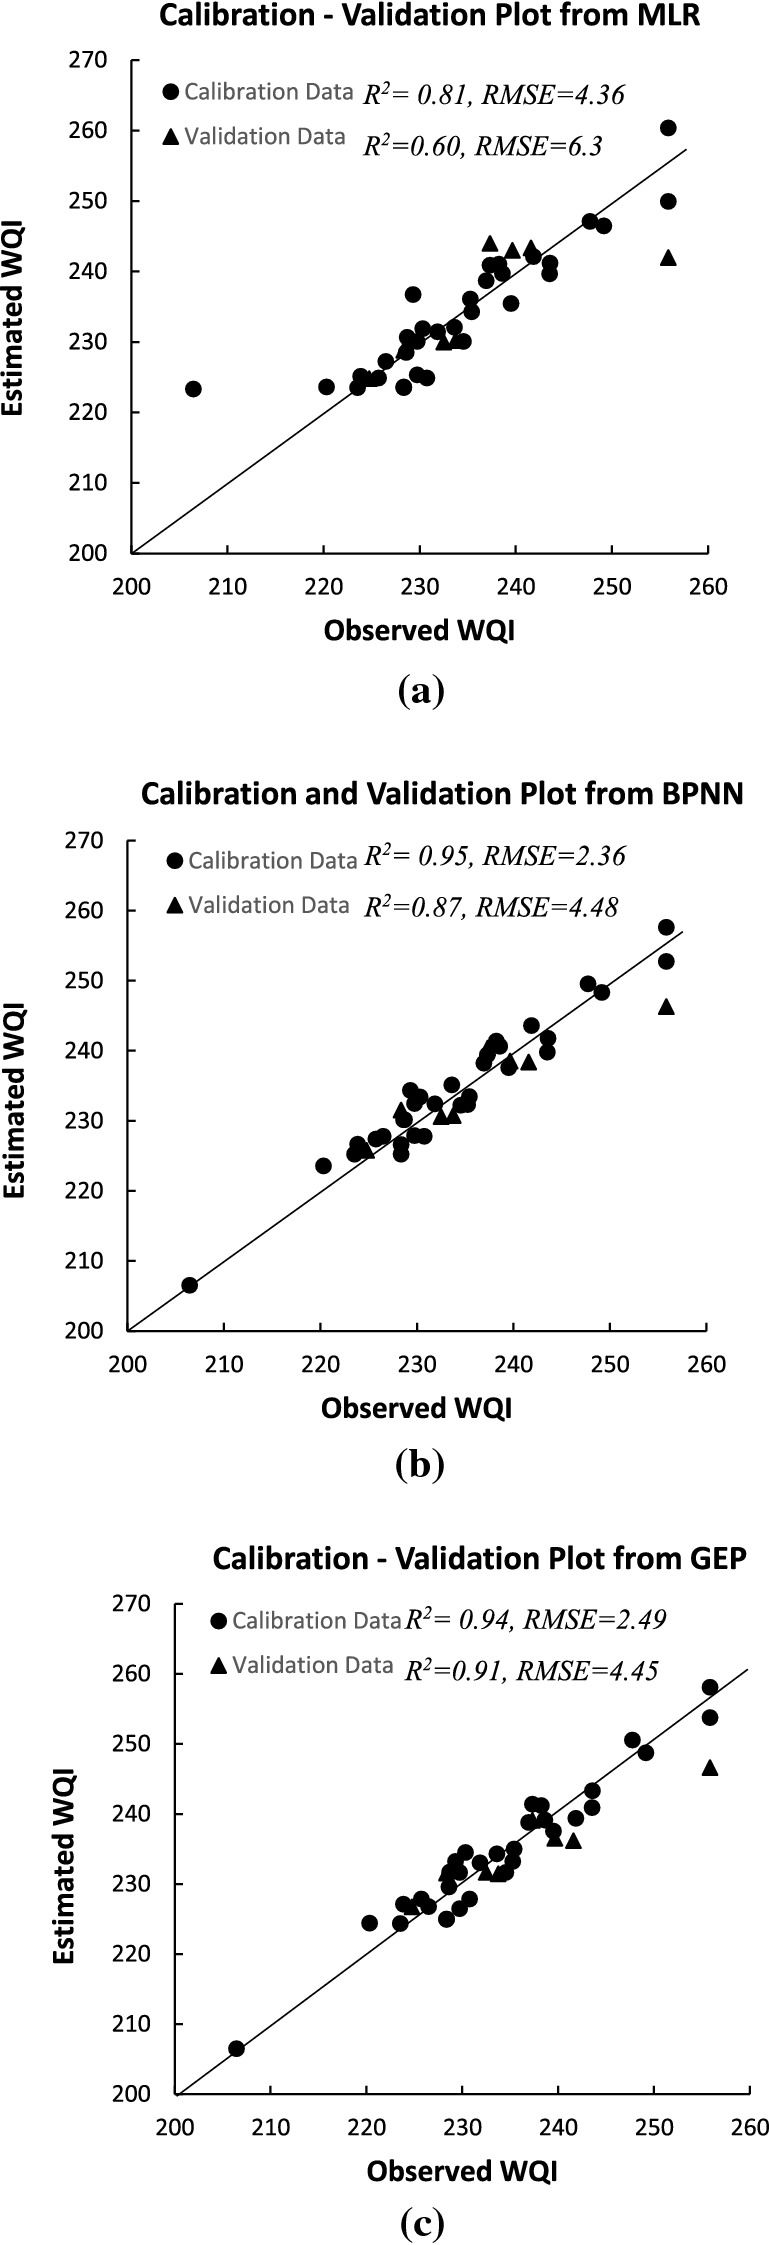
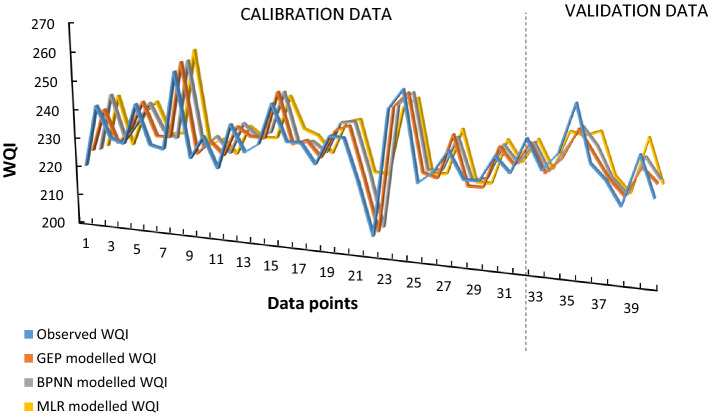
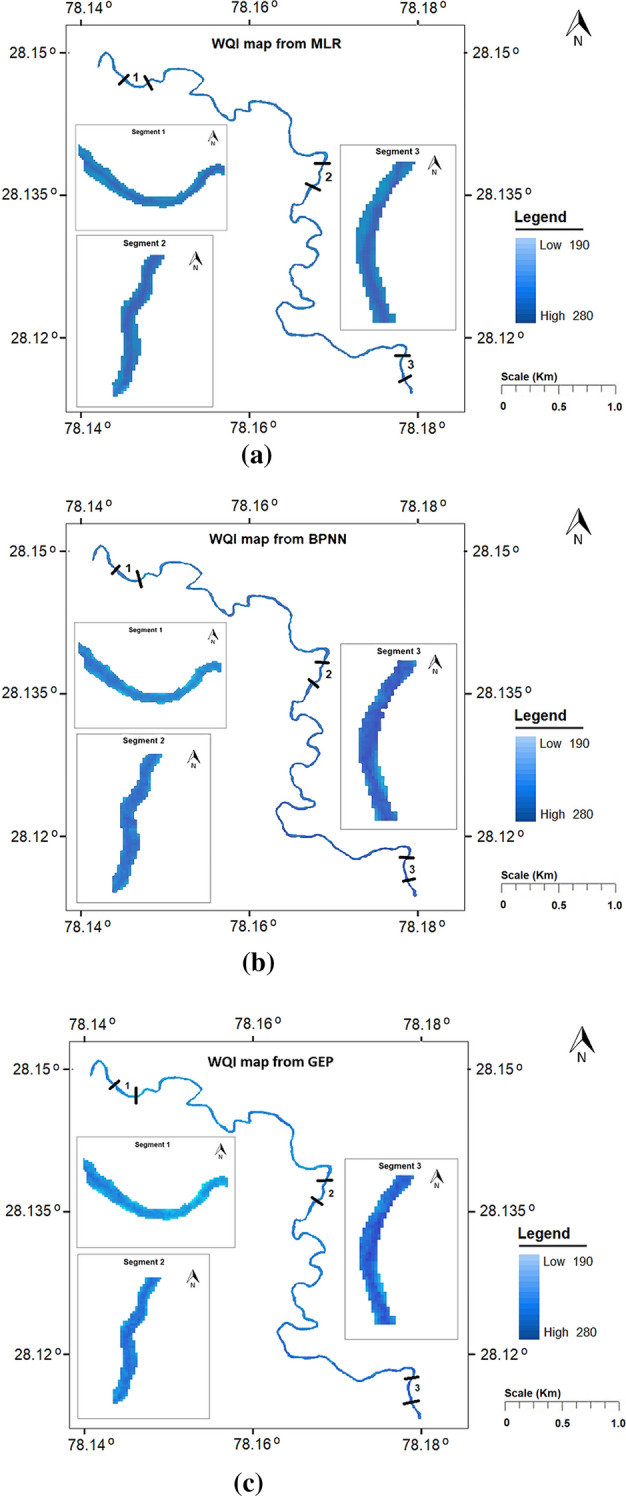
The present study evaluates the water quality status of 6-km-long Kali River stretch that passes through the Aligarh district in Uttar Pradesh, India, by utilizing high-resolution IRS P6 LISS IV imagery. In situ river water samples collected at 40 random locations were analyzed for seven physicochemical and four heavy metal concentrations, and the water quality index (WQI) was computed for each sampling location. A set of 11 spectral reflectance band combinations were formulated to identify the most significant band combination that is related to the observed WQI at each sampling location. Three approaches, namely multiple linear regression (MLR), backpropagation neural network (BPNN) and gene expression programming (GEP), were employed to relate WQI as a function of most significant band combination. Comparative assessment among the three utilized approaches was performed via quantitative indicators such as , RMSE and MAE. Results revealed that WQI estimates ranged between 203.7 and 262.33 and rated as "" status. Results further indicated that GEP performed better than BPNN and MLR approaches and predicted WQI estimates with high values (i.e., 0.94 for calibration and 0.91 for validation data), low RMSE and MAE values (i.e., 2.49 and 2.16 for calibration and 4.45 and 3.53 for validation data). Moreover, both GEP and BPNN depicted superiority over MLR approach that yielded WQI with  ~ 0.81 and 0.67 for calibration and validation data, respectively. WQI maps generated from the three approaches corroborate the existing pollution levels along the river stretch. In order to examine the significant differences among WQI estimates from the three approaches, one-way ANOVA test was performed, and the results in terms of -statistic ( = 0.01) and -value ( = 0.994 > 0.05) revealed WQI estimates as "," reasoned to the small water sample size (i.e.,  = 40). The study therefore recommends GEP as more rational and a better alternative for precise water quality monitoring of surface water bodies by producing simplified mathematical expressions.

摘要

本研究利用高分辨率的印度遥感卫星6号(IRS P6)线性成像自扫描传感器-4(LISS IV)影像,评估了流经印度北方邦阿里格尔区的卡里河6公里河段的水质状况。在40个随机地点采集了原位河水样本,分析了7种物理化学指标和4种重金属浓度,并计算了每个采样点的水质指数(WQI)。制定了一组11种光谱反射率波段组合,以确定与每个采样点观测到的WQI相关的最显著波段组合。采用多元线性回归(MLR)、反向传播神经网络(BPNN)和基因表达式编程(GEP)三种方法,将WQI作为最显著波段组合的函数进行关联。通过诸如 、均方根误差(RMSE)和平均绝对误差(MAE)等定量指标,对所采用的三种方法进行了比较评估。结果显示,WQI估计值在203.7至262.33之间,水质评级为“ ”状态。结果还表明,GEP的性能优于BPNN和MLR方法,其预测的WQI估计值具有较高的 值(即校准数据为0.94,验证数据为0.91)、较低的RMSE和MAE值(即校准数据为2.49和2.16,验证数据为4.45和3.53)。此外,GEP和BPNN在性能上均优于MLR方法,MLR方法在校准和验证数据中得出的WQI的 值分别约为0.81和0.67。三种方法生成的WQI地图证实了该河段沿线现有的污染水平。为了检验三种方法得出的WQI估计值之间的显著差异,进行了单因素方差分析,结果在F统计量(F = 0.01)和p值(p = 0.994 > 0.05)方面显示,WQI估计值为“ ”,原因是水样数量较少(即n = 40)。因此,该研究建议GEP更为合理,是通过生成简化数学表达式对地表水体进行精确水质监测的更好选择。

https://cdn.ncbi.nlm.nih.gov/pmc/blobs/7831/8058146/1addc5f458e7/10668_2021_1437_Fig10_HTML.jpg
https://cdn.ncbi.nlm.nih.gov/pmc/blobs/7831/8058146/a1932b3c8dec/10668_2021_1437_Fig1_HTML.jpg
https://cdn.ncbi.nlm.nih.gov/pmc/blobs/7831/8058146/416e15c27612/10668_2021_1437_Fig2_HTML.jpg
https://cdn.ncbi.nlm.nih.gov/pmc/blobs/7831/8058146/47c4704053ab/10668_2021_1437_Fig3_HTML.jpg
https://cdn.ncbi.nlm.nih.gov/pmc/blobs/7831/8058146/ac6502bc8df8/10668_2021_1437_Fig4_HTML.jpg
https://cdn.ncbi.nlm.nih.gov/pmc/blobs/7831/8058146/bcb80c578175/10668_2021_1437_Fig5_HTML.jpg
https://cdn.ncbi.nlm.nih.gov/pmc/blobs/7831/8058146/66d4b8d63cd5/10668_2021_1437_Fig6_HTML.jpg
https://cdn.ncbi.nlm.nih.gov/pmc/blobs/7831/8058146/993aab82ae49/10668_2021_1437_Fig7_HTML.jpg
https://cdn.ncbi.nlm.nih.gov/pmc/blobs/7831/8058146/efe2be5d50c2/10668_2021_1437_Fig8_HTML.jpg
https://cdn.ncbi.nlm.nih.gov/pmc/blobs/7831/8058146/c842da95d3e2/10668_2021_1437_Fig9_HTML.jpg
https://cdn.ncbi.nlm.nih.gov/pmc/blobs/7831/8058146/1addc5f458e7/10668_2021_1437_Fig10_HTML.jpg

相似文献

1
Remote sensing-based water quality index estimation using data-driven approaches: a case study of the Kali River in Uttar Pradesh, India.基于数据驱动方法的遥感水质指数估算:以印度北方邦的卡利河为例
Environ Dev Sustain. 2021;23(12):18252-18277. doi: 10.1007/s10668-021-01437-6. Epub 2021 Apr 21.
2
Assessment of spatial and temporal variations in water quality by the application of multivariate statistical methods in the Kali River, Uttar Pradesh, India.应用多元统计方法评估印度北方邦卡利河的水质时空变化。
Environ Monit Assess. 2020 May 26;192(6):394. doi: 10.1007/s10661-020-08307-0.
3
Prediction of weighted arithmetic water quality index for urban water quality using ensemble machine learning model.基于集成机器学习模型的城市水质加权算术水质指数预测
Chemosphere. 2024 Mar;352:141393. doi: 10.1016/j.chemosphere.2024.141393. Epub 2024 Feb 5.
4
Evaluation of water quality using water quality index, synthetic pollution index, and GIS technique: a case study of the river Gomti, Lucknow, India.利用水质指数、综合污染指数和 GIS 技术评价水质:印度勒克瑙戈默蒂河案例研究。
Environ Sci Pollut Res Int. 2022 Nov;29(54):81954-81969. doi: 10.1007/s11356-022-21493-3. Epub 2022 Jun 23.
5
Heavy Metal Contamination in Soils and Crops Irrigated by Kali River in Uttar Pradesh, India.印度北方邦卡里河灌溉土壤和作物的重金属污染。
Bull Environ Contam Toxicol. 2021 Nov;107(5):931-937. doi: 10.1007/s00128-021-03349-7. Epub 2021 Aug 9.
6
Impact of rapid urbanization on the surface water's quality: a long-term environmental and physicochemical investigation of Tajan river, Iran (2007-2017).快速城市化对地表水质的影响:伊朗塔詹河的长期环境和理化调查(2007-2017 年)。
Environ Sci Pollut Res Int. 2020 Mar;27(8):8439-8450. doi: 10.1007/s11356-019-07477-w. Epub 2020 Jan 4.
7
Water quality assessment in the ecologically stressed lower and estuarine stretches of river Ganga using multivariate statistical tool.利用多元统计工具评估恒河下游和河口生态压力河段的水质。
Environ Monit Assess. 2022 Jun 1;194(7):469. doi: 10.1007/s10661-022-10007-w.
8
Seasonal rationalization of river water quality sampling locations: a comparative study of the modified Sanders and multivariate statistical approaches.河流水质采样地点的季节性合理化:改良桑德斯法与多元统计方法的比较研究
Environ Sci Pollut Res Int. 2016 Feb;23(3):2308-28. doi: 10.1007/s11356-015-5349-y. Epub 2015 Sep 26.
9
Evaluation of water quality based on a machine learning algorithm and water quality index for the Ebinur Lake Watershed, China.基于机器学习算法和水质指数对中国艾比湖流域水质的评估
Sci Rep. 2017 Oct 9;7(1):12858. doi: 10.1038/s41598-017-12853-y.
10
Water quality index assessment methods for surface water: A case study of the Citarum River in Indonesia.地表水水质指数评估方法:以印度尼西亚芝塔龙河为例。
Heliyon. 2022 Jul 3;8(7):e09848. doi: 10.1016/j.heliyon.2022.e09848. eCollection 2022 Jul.

引用本文的文献

1
Neuro-Particle Swarm Optimization Based In-Situ Prediction Model for Heavy Metals Concentration in Groundwater and Surface Water.基于神经粒子群优化算法的地下水和地表水中重金属浓度原位预测模型
Toxics. 2022 Feb 18;10(2):95. doi: 10.3390/toxics10020095.