• 文献检索
  • 文档翻译
  • 深度研究
  • 学术资讯
  • Suppr Zotero 插件Zotero 插件
  • 邀请有礼
  • 套餐&价格
  • 历史记录
应用&插件
Suppr Zotero 插件Zotero 插件浏览器插件Mac 客户端Windows 客户端微信小程序
定价
高级版会员购买积分包购买API积分包
服务
文献检索文档翻译深度研究API 文档MCP 服务
关于我们
关于 Suppr公司介绍联系我们用户协议隐私条款
关注我们

Suppr 超能文献

核心技术专利:CN118964589B侵权必究
粤ICP备2023148730 号-1Suppr @ 2026

文献检索

告别复杂PubMed语法,用中文像聊天一样搜索,搜遍4000万医学文献。AI智能推荐,让科研检索更轻松。

立即免费搜索

文件翻译

保留排版,准确专业,支持PDF/Word/PPT等文件格式,支持 12+语言互译。

免费翻译文档

深度研究

AI帮你快速写综述,25分钟生成高质量综述,智能提取关键信息,辅助科研写作。

立即免费体验

基于从数字痕迹数据中得出的兴趣点访问波动来量化社区弹性。

Quantifying community resilience based on fluctuations in visits to points-of-interest derived from digital trace data.

机构信息

Urban Resilience.AI Lab, Zachry Department of Civil and Environmental Engineering, Texas A&M University, College Station, TX, USA.

出版信息

J R Soc Interface. 2021 Apr;18(177):20210158. doi: 10.1098/rsif.2021.0158. Epub 2021 Apr 28.

DOI:10.1098/rsif.2021.0158
PMID:33906388
原文链接:https://pmc.ncbi.nlm.nih.gov/articles/PMC8086905/
Abstract

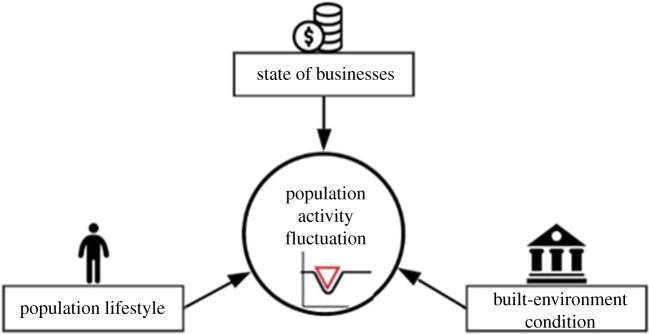
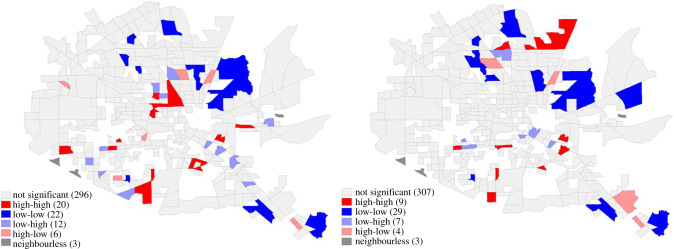
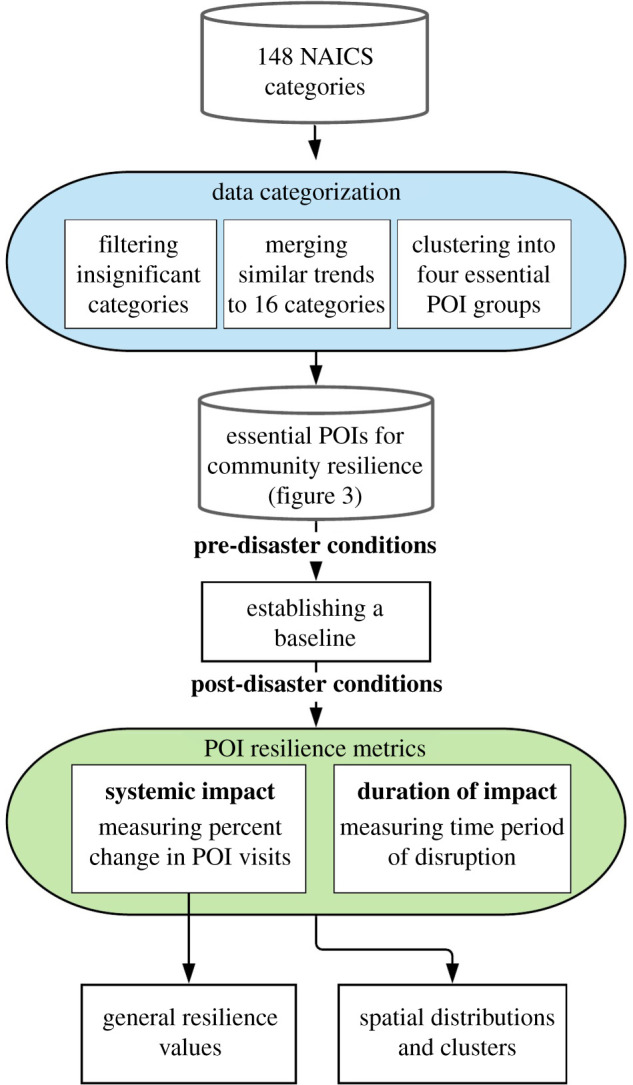
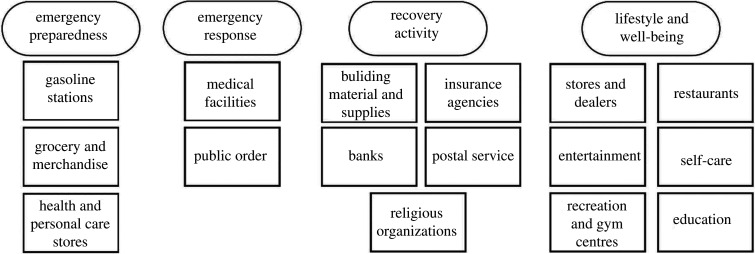
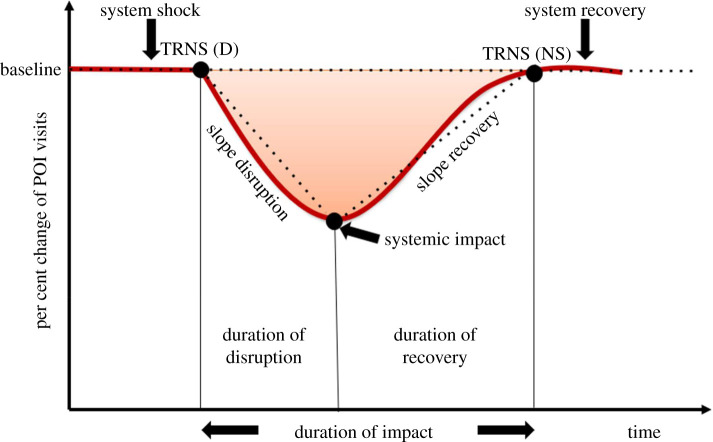
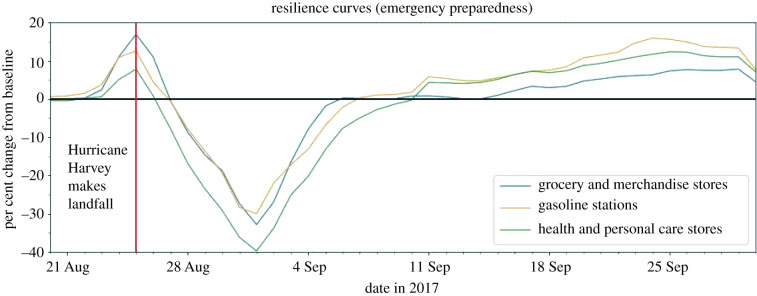
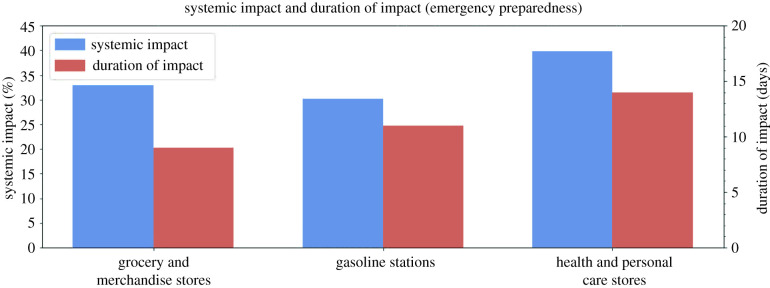
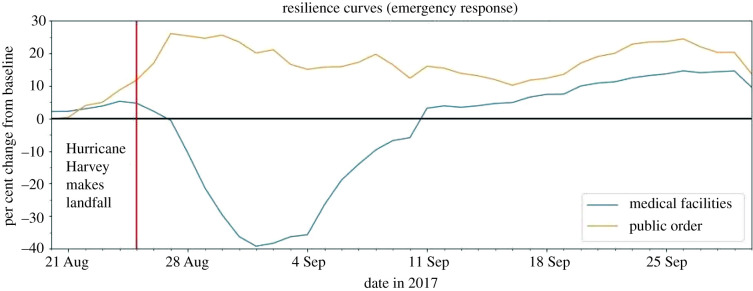
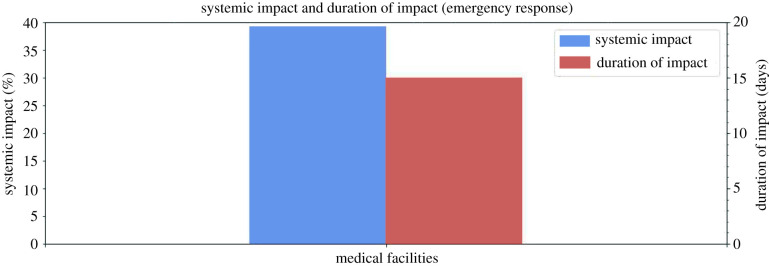
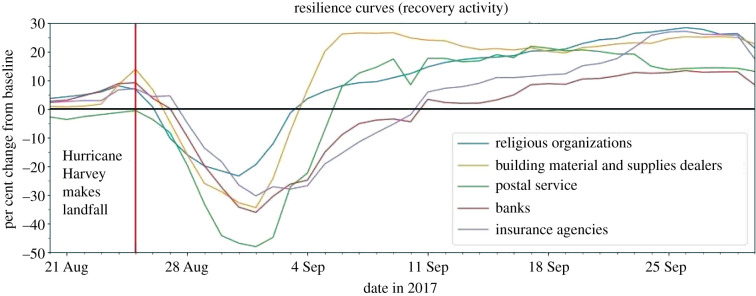
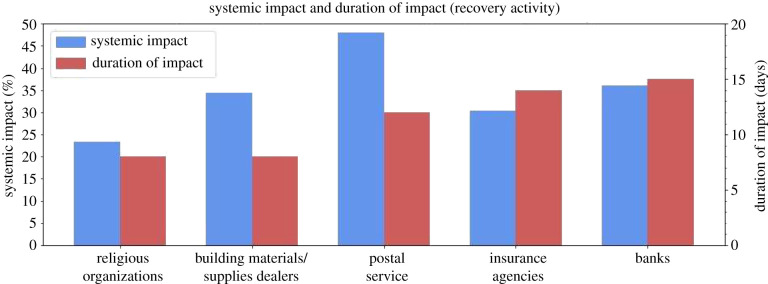
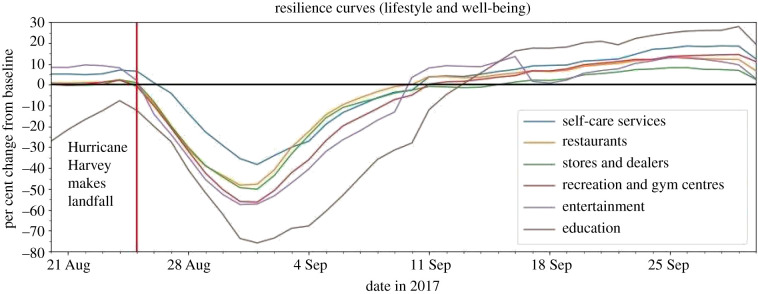
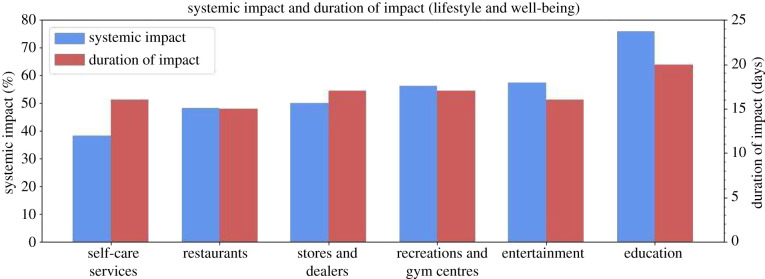
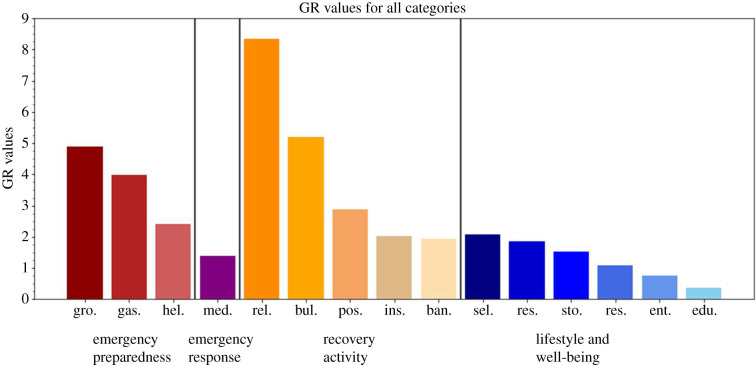
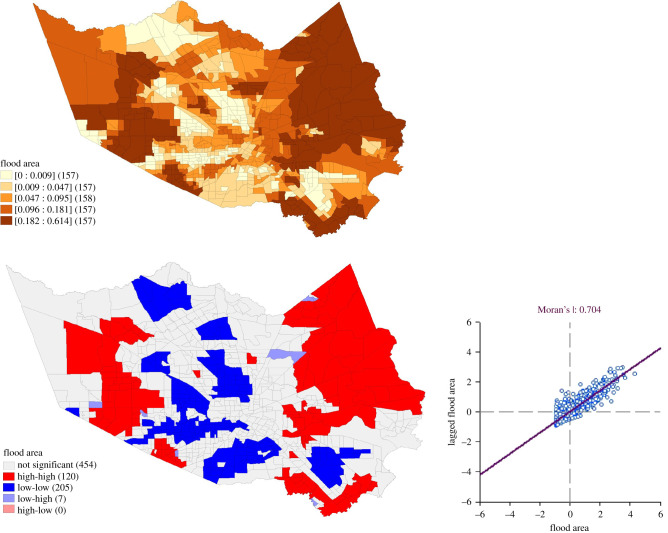
This research establishes a methodological framework for quantifying community resilience based on fluctuations in a population's activity during a natural disaster. Visits to points-of-interests (POIs) over time serve as a proxy for activities to capture the combined effects of perturbations in lifestyles, the built environment and the status of business. This study used digital trace data related to unique visits to POIs in the Houston metropolitan area during Hurricane Harvey in 2017. Resilience metrics in the form of systemic impact, duration of impact, and general resilience (GR) values were examined for the region along with their spatial distributions. The results show that certain categories, such as religious organizations and building material and supplies dealers had better resilience metrics-low systemic impact, short duration of impact, and high GR. Other categories such as medical facilities and entertainment had worse resilience metrics-high systemic impact, long duration of impact and low GR. Spatial analyses revealed that areas in the community with lower levels of resilience metrics also experienced extensive flooding. This insight demonstrates the validity of the approach proposed in this study for quantifying and analysing data for community resilience patterns using digital trace/location-intelligence data related to population activities. While this study focused on the Houston metropolitan area and only analysed one natural hazard, the same approach could be applied to other communities and disaster contexts. Such resilience metrics bring valuable insight into prioritizing resource allocation in the recovery process.

摘要

本研究基于自然灾害期间人口活动的波动,建立了量化社区弹性的方法框架。随着时间的推移,对兴趣点(POI)的访问可以作为活动的代理,以捕捉生活方式、建筑环境和商业状况变化的综合影响。本研究使用了与 2017 年休斯顿大都市区哈维飓风期间独特访问 POI 相关的数字跟踪数据。研究还检查了该地区的系统影响、影响持续时间和一般弹性(GR)值等弹性指标及其空间分布。结果表明,某些类别(如宗教组织和建筑材料及供应经销商)具有更好的弹性指标,即低系统影响、短影响持续时间和高 GR。其他类别,如医疗设施和娱乐设施,具有较差的弹性指标,即高系统影响、长影响持续时间和低 GR。空间分析表明,社区中弹性指标较低的区域也经历了广泛的洪水。这一见解证明了本研究提出的方法的有效性,该方法使用与人口活动相关的数字跟踪/位置智能数据来量化和分析社区弹性模式的数据。虽然本研究集中在休斯顿大都市区,并且只分析了一种自然灾害,但同样的方法可以应用于其他社区和灾害情况。这些弹性指标为资源在恢复过程中的分配提供了有价值的见解。

https://cdn.ncbi.nlm.nih.gov/pmc/blobs/e0bd/8086905/0da320914489/rsif20210158f15.jpg
https://cdn.ncbi.nlm.nih.gov/pmc/blobs/e0bd/8086905/27937e1040fe/rsif20210158f01.jpg
https://cdn.ncbi.nlm.nih.gov/pmc/blobs/e0bd/8086905/b39a4c417f19/rsif20210158f02.jpg
https://cdn.ncbi.nlm.nih.gov/pmc/blobs/e0bd/8086905/84d6bedb00a0/rsif20210158f03.jpg
https://cdn.ncbi.nlm.nih.gov/pmc/blobs/e0bd/8086905/8fb6950fe228/rsif20210158f04.jpg
https://cdn.ncbi.nlm.nih.gov/pmc/blobs/e0bd/8086905/59ca570e5d9d/rsif20210158f05.jpg
https://cdn.ncbi.nlm.nih.gov/pmc/blobs/e0bd/8086905/60fee7e907a7/rsif20210158f06.jpg
https://cdn.ncbi.nlm.nih.gov/pmc/blobs/e0bd/8086905/a91a5d2bec20/rsif20210158f07.jpg
https://cdn.ncbi.nlm.nih.gov/pmc/blobs/e0bd/8086905/6225c0259a2d/rsif20210158f08.jpg
https://cdn.ncbi.nlm.nih.gov/pmc/blobs/e0bd/8086905/4d3334d26e12/rsif20210158f09.jpg
https://cdn.ncbi.nlm.nih.gov/pmc/blobs/e0bd/8086905/069404ca7800/rsif20210158f10.jpg
https://cdn.ncbi.nlm.nih.gov/pmc/blobs/e0bd/8086905/7219ab076b43/rsif20210158f11.jpg
https://cdn.ncbi.nlm.nih.gov/pmc/blobs/e0bd/8086905/445107c58b00/rsif20210158f12.jpg
https://cdn.ncbi.nlm.nih.gov/pmc/blobs/e0bd/8086905/dbddfd89fde7/rsif20210158f13.jpg
https://cdn.ncbi.nlm.nih.gov/pmc/blobs/e0bd/8086905/95997f20bf81/rsif20210158f14.jpg
https://cdn.ncbi.nlm.nih.gov/pmc/blobs/e0bd/8086905/0da320914489/rsif20210158f15.jpg

相似文献

1
Quantifying community resilience based on fluctuations in visits to points-of-interest derived from digital trace data.基于从数字痕迹数据中得出的兴趣点访问波动来量化社区弹性。
J R Soc Interface. 2021 Apr;18(177):20210158. doi: 10.1098/rsif.2021.0158. Epub 2021 Apr 28.
2
Location intelligence reveals the extent, timing, and spatial variation of hurricane preparedness.位置智能揭示了飓风准备的程度、时间和空间变化。
Sci Rep. 2022 Sep 27;12(1):16121. doi: 10.1038/s41598-022-20571-3.
3
Health Disparities and Climate Change: The Intersection of Three Disaster Events on Vulnerable Communities in Houston, Texas.健康不平等与气候变化:德克萨斯州休斯顿脆弱社区的三种灾害事件的交集。
Int J Environ Res Public Health. 2021 Dec 21;19(1):35. doi: 10.3390/ijerph19010035.
4
Building disaster resilience using social messaging networks: the WeChat community in Houston, Texas, during Hurricane Harvey.利用社交信息网络建立灾害恢复能力:德克萨斯州休斯敦的微信社区在哈维飓风期间的情况。
Disasters. 2020 Oct;44(4):726-752. doi: 10.1111/disa.12388. Epub 2020 Mar 11.
5
A Spatial and Temporal Investigation of Medical Surge in Dallas-Fort Worth During Hurricane Harvey, Texas 2017.2017 年德克萨斯州哈维飓风期间达拉斯-沃思堡地区医疗资源激增的时空调查。
Disaster Med Public Health Prep. 2020 Feb;14(1):111-118. doi: 10.1017/dmp.2019.143.
6
Community resilience to cyclone and storm surge disasters: Evidence from coastal communities of Bangladesh.社区对气旋和风暴潮灾害的韧性:来自孟加拉国沿海社区的证据。
J Environ Manage. 2020 Jun 15;264:110457. doi: 10.1016/j.jenvman.2020.110457. Epub 2020 Mar 25.
7
Island communities and disaster resilience: Applying the EnRiCH community resilience framework.岛屿社区与抗灾能力:应用 EnRiCH 社区抗灾能力框架。
Public Health Nurs. 2022 Jan;39(1):62-70. doi: 10.1111/phn.13007. Epub 2021 Nov 4.
8
Latent sub-structural resilience mechanisms in temporal human mobility networks during urban flooding.城市洪涝期间,人类时间移动网络中潜在的亚结构弹性机制。
Sci Rep. 2023 Jul 6;13(1):10953. doi: 10.1038/s41598-023-37965-6.
9
Human-centric infrastructure resilience: Uncovering well-being risk disparity due to infrastructure disruptions in disasters.以人为本的基础设施韧性:揭示灾害中因基础设施中断而导致的福祉风险差异。
PLoS One. 2020 Jun 18;15(6):e0234381. doi: 10.1371/journal.pone.0234381. eCollection 2020.
10
Benchmarking Community Disaster Resilience in Nepal.尼泊尔社区抗灾能力基准测试。
Int J Environ Res Public Health. 2020 Mar 18;17(6):1985. doi: 10.3390/ijerph17061985.

引用本文的文献

1
Behaviour-based dependency networks between places shape urban economic resilience.场所之间基于行为的依赖网络塑造了城市经济韧性。
Nat Hum Behav. 2025 Mar;9(3):496-506. doi: 10.1038/s41562-024-02072-7. Epub 2024 Dec 23.
2
Network diffusion model reveals recovery multipliers and heterogeneous spatial effects in post-disaster community recovery.网络扩散模型揭示了灾后社区恢复中的恢复乘数和异质空间效应。
Sci Rep. 2023 Nov 3;13(1):19032. doi: 10.1038/s41598-023-46096-x.
3
Disparities in access and association between access to critical facilities during day-to-day and disrupted access as a result of storm extreme weather events.

本文引用的文献

1
Determinants of Risk Disparity Due to Infrastructure Service Losses in Disasters: A Household Service Gap Model.灾害中基础设施服务损失导致风险差异的决定因素:家庭服务差距模型
Risk Anal. 2021 Dec;41(12):2336-2355. doi: 10.1111/risa.13738. Epub 2021 Apr 29.
2
Human-centric infrastructure resilience: Uncovering well-being risk disparity due to infrastructure disruptions in disasters.以人为本的基础设施韧性:揭示灾害中因基础设施中断而导致的福祉风险差异。
PLoS One. 2020 Jun 18;15(6):e0234381. doi: 10.1371/journal.pone.0234381. eCollection 2020.
3
Understanding post-disaster population recovery patterns.
日常获取关键设施的机会差异,以及风暴等极端天气事件导致的获取中断与机会之间的关联。
Heliyon. 2023 Aug 1;9(8):e18841. doi: 10.1016/j.heliyon.2023.e18841. eCollection 2023 Aug.
4
Latent sub-structural resilience mechanisms in temporal human mobility networks during urban flooding.城市洪涝期间,人类时间移动网络中潜在的亚结构弹性机制。
Sci Rep. 2023 Jul 6;13(1):10953. doi: 10.1038/s41598-023-37965-6.
5
COVID-19 and campus users: A longitudinal and place-based study of university mobilities in Texas.新冠疫情与校园用户:德克萨斯州大学流动性的纵向和基于地点的研究。
Sustain Cities Soc. 2023 Sep;96:104656. doi: 10.1016/j.scs.2023.104656. Epub 2023 May 14.
6
Metro travel and perceived COVID-19 infection risks: A case study of Hong Kong.地铁出行与感知到的新冠病毒感染风险:以香港为例的案例研究
Cities. 2023 Jun;137:104307. doi: 10.1016/j.cities.2023.104307. Epub 2023 Mar 27.
7
Quantifying human mobility resilience to the COVID-19 pandemic: A case study of Beijing, China.量化人类流动性对新冠疫情的恢复力:以中国北京为例
Sustain Cities Soc. 2023 Feb;89:104314. doi: 10.1016/j.scs.2022.104314. Epub 2022 Nov 20.
8
Characterizing equitable access to grocery stores during disasters using location-based data.利用基于位置的数据描述灾害期间公平获取杂货店的情况。
Sci Rep. 2022 Nov 23;12(1):20203. doi: 10.1038/s41598-022-23532-y.
9
Community-scale big data reveals disparate impacts of the Texas winter storm of 2021 and its managed power outage.社区规模的大数据揭示了2021年得克萨斯州冬季风暴及其可控停电造成的不同影响。
Humanit Soc Sci Commun. 2022;9(1):335. doi: 10.1057/s41599-022-01353-8. Epub 2022 Sep 24.
10
Location intelligence reveals the extent, timing, and spatial variation of hurricane preparedness.位置智能揭示了飓风准备的程度、时间和空间变化。
Sci Rep. 2022 Sep 27;12(1):16121. doi: 10.1038/s41598-022-20571-3.
了解灾后人口恢复模式。
J R Soc Interface. 2020 Feb;17(163):20190532. doi: 10.1098/rsif.2019.0532. Epub 2020 Feb 19.
4
Modeling of inter-organizational coordination dynamics in resilience planning of infrastructure systems: A multilayer network simulation framework.基础设施系统弹性规划中的组织间协调动态建模:多层次网络模拟框架。
PLoS One. 2019 Nov 13;14(11):e0224522. doi: 10.1371/journal.pone.0224522. eCollection 2019.
5
Robust component: a robustness measure that incorporates access to critical facilities under disruptions.稳健性组件:一种稳健性度量,可在发生中断时纳入对关键设施的访问。
J R Soc Interface. 2019 Aug 30;16(157):20190149. doi: 10.1098/rsif.2019.0149. Epub 2019 Aug 7.
6
Quantifying Community Resilience Using Hierarchical Bayesian Kernel Methods: A Case Study on Recovery from Power Outages.利用分层贝叶斯核方法量化社区弹性:以从停电中恢复为例的研究。
Risk Anal. 2019 Sep;39(9):1930-1948. doi: 10.1111/risa.13343. Epub 2019 Jul 9.
7
Toward Convergence Disaster Research: Building Integrative Theories Using Simulation.迈向趋同灾害研究:运用模拟构建综合理论。
Risk Anal. 2021 Jul;41(7):1078-1086. doi: 10.1111/risa.13303. Epub 2019 Mar 18.
8
Resilience as an emergent property of human-infrastructure dynamics: A multi-agent simulation model for characterizing regime shifts and tipping point behaviors in infrastructure systems.弹性作为人类-基础设施动态的涌现特性:一个用于刻画基础设施系统中状态转变和 tipping 点行为的多主体仿真模型。
PLoS One. 2018 Nov 21;13(11):e0207674. doi: 10.1371/journal.pone.0207674. eCollection 2018.
9
What Do We Mean by 'Community Resilience'? A Systematic Literature Review of How It Is Defined in the Literature.我们所说的“社区恢复力”是什么意思?关于其在文献中的定义的系统文献综述。
PLoS Curr. 2017 Feb 1;9:ecurrents.dis.db775aff25efc5ac4f0660ad9c9f7db2. doi: 10.1371/currents.dis.db775aff25efc5ac4f0660ad9c9f7db2.
10
Disasters as Learning Experiences or Disasters as Policy Opportunities? Examining Flood Insurance Purchases after Hurricanes.灾难是学习经验还是政策机遇?飓风后洪水保险购买情况分析
Risk Anal. 2017 Mar;37(3):517-530. doi: 10.1111/risa.12646. Epub 2016 Aug 31.