van der Weide Robin H, van den Brand Teun, Haarhuis Judith H I, Teunissen Hans, Rowland Benjamin D, de Wit Elzo
Division of Gene Regulation, Oncode Institute and The Netherlands Cancer Institute, Plesmanlaan 121, 1066 CX Amsterdam, The Netherlands.
Division of Cell Biology, The Netherlands Cancer Institute, Plesmanlaan 121, 1066CX Amsterdam, The Netherlands.
NAR Genom Bioinform. 2021 May 22;3(2):lqab040. doi: 10.1093/nargab/lqab040. eCollection 2021 Jun.
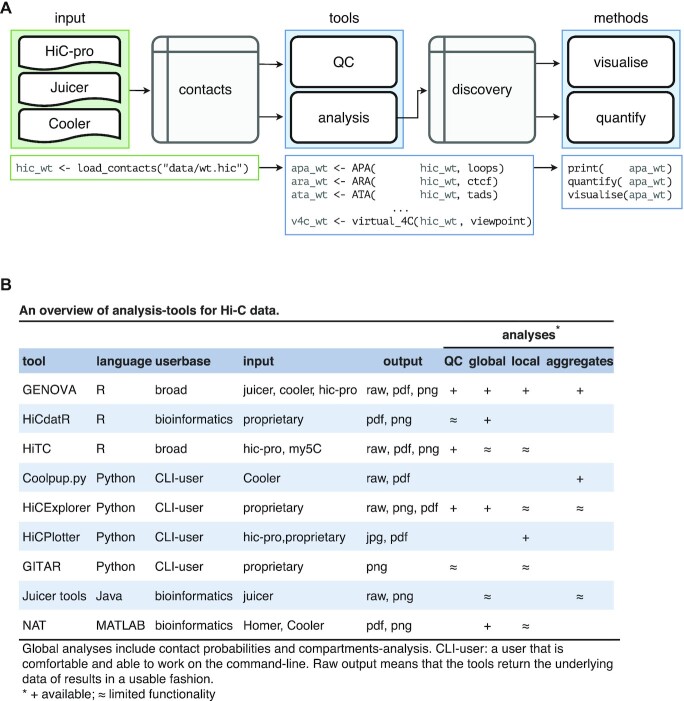
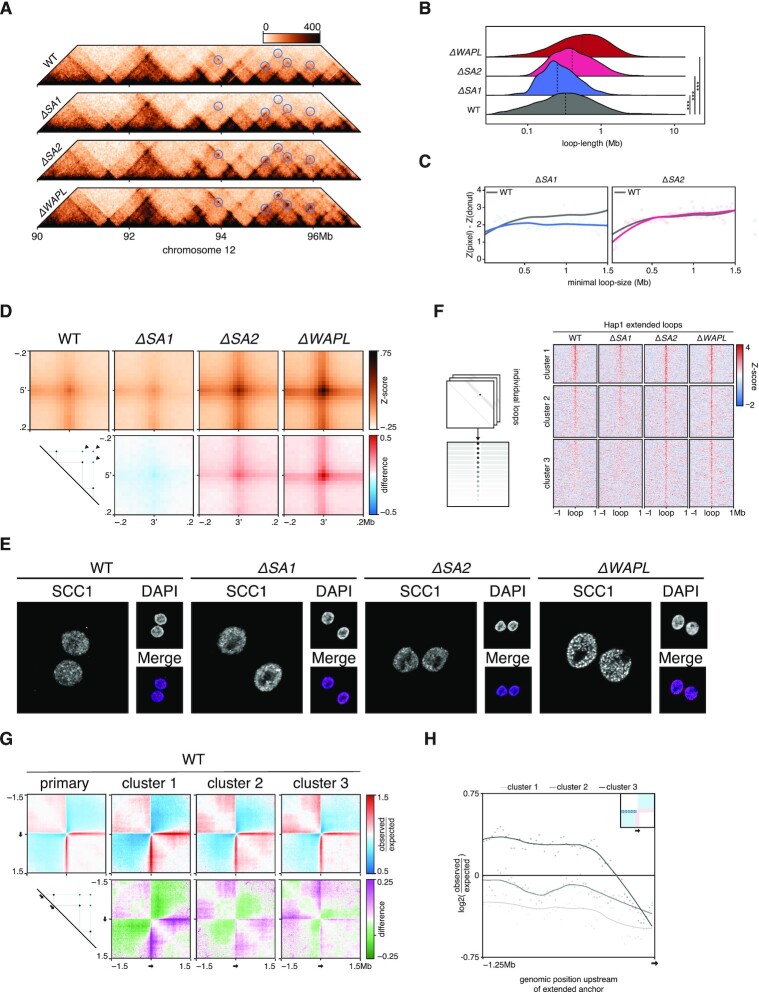
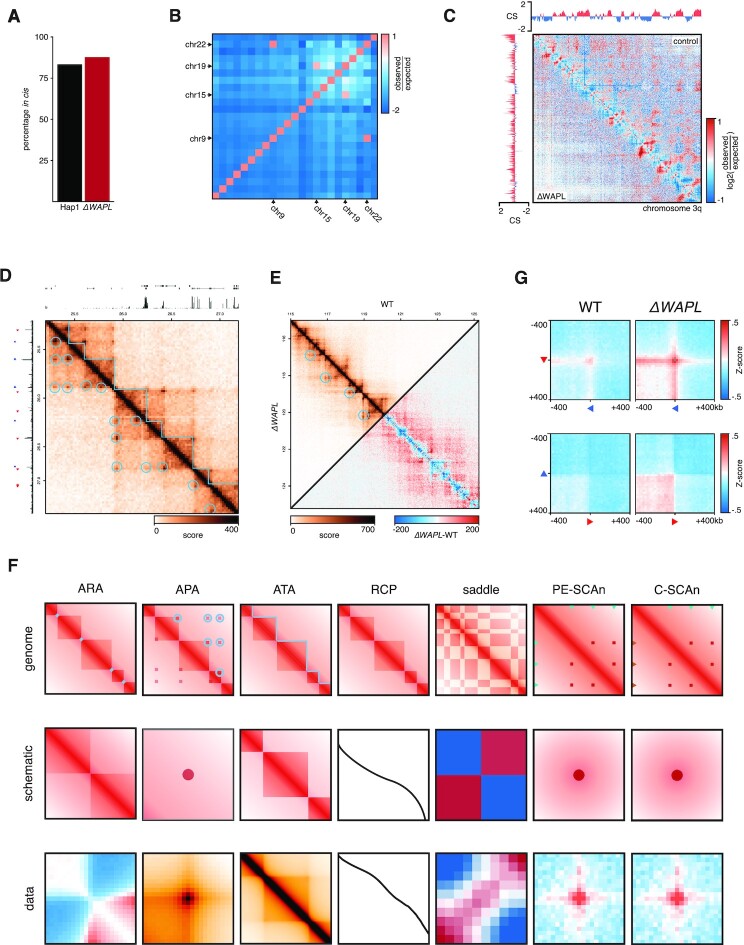
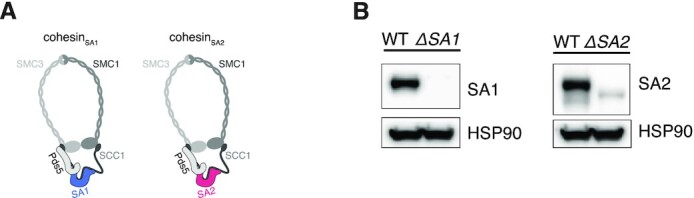
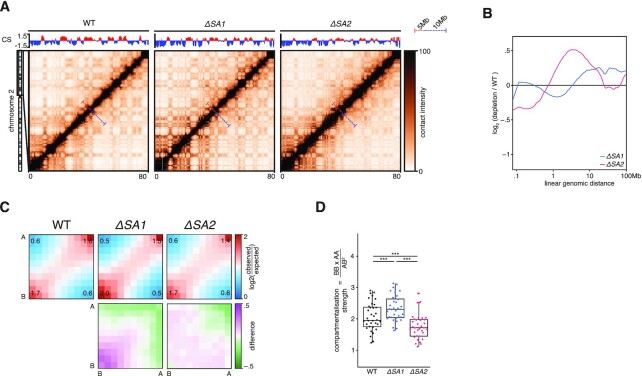
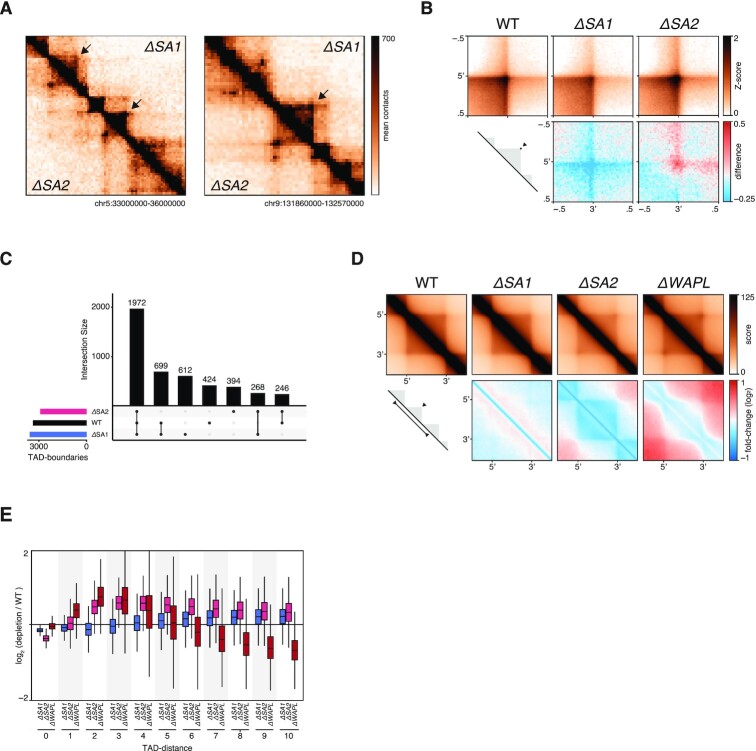
Conformation capture-approaches like Hi-C can elucidate chromosome structure at a genome-wide scale. Hi-C datasets are large and require specialised software. Here, we present GENOVA: a user-friendly software package to analyse and visualise chromosome conformation capture (3C) data. GENOVA is an R-package that includes the most common Hi-C analyses, such as compartment and insulation score analysis. It can create annotated heatmaps to visualise the contact frequency at a specific locus and aggregate Hi-C signal over user-specified genomic regions such as ChIP-seq data. Finally, our package supports output from the major mapping-pipelines. We demonstrate the capabilities of GENOVA by analysing Hi-C data from HAP1 cell lines in which the cohesin-subunits SA1 and SA2 were knocked out. We find that ΔSA1 cells gain intra-TAD interactions and increase compartmentalisation. ΔSA2 cells have longer loops and a less compartmentalised genome. These results suggest that cohesin forms longer loops, while cohesin plays a role in forming and maintaining intra-TAD interactions. Our data supports the model that the genome is provided structure in 3D by the counter-balancing of loop formation on one hand, and compartmentalization on the other hand. By differentially controlling loops, cohesin and cohesin therefore also affect nuclear compartmentalization. We show that GENOVA is an easy to use R-package, that allows researchers to explore Hi-C data in great detail.
像Hi-C这样的构象捕获方法可以在全基因组范围内阐明染色体结构。Hi-C数据集规模庞大,需要专门的软件。在此,我们展示了GENOVA:一个用于分析和可视化染色体构象捕获(3C)数据的用户友好型软件包。GENOVA是一个R包,包含最常见的Hi-C分析,如区室和绝缘分数分析。它可以创建带注释的热图,以可视化特定基因座处的接触频率,并在用户指定的基因组区域(如ChIP-seq数据)上汇总Hi-C信号。最后,我们的软件包支持主要映射管道的输出。我们通过分析来自敲除了黏连蛋白亚基SA1和SA2的HAP1细胞系的Hi-C数据,展示了GENOVA的功能。我们发现,ΔSA1细胞获得了TAD内相互作用并增加了区室化。ΔSA2细胞具有更长的环和更低的基因组区室化。这些结果表明,黏连蛋白形成更长的环,而黏连蛋白在形成和维持TAD内相互作用中发挥作用。我们的数据支持这样的模型,即基因组一方面通过环形成的平衡,另一方面通过区室化,在三维空间中获得结构。因此,通过差异控制环,黏连蛋白和黏连蛋白也会影响核区室化。我们表明,GENOVA是一个易于使用的R包,它使研究人员能够非常详细地探索Hi-C数据。