Ruiz-Villalba Adrián, Ruijter Jan M, van den Hoff Maurice J B
Department of Animal Biology, Faculty of Sciences, Instituto Malagueño de Biomedicina (IBIMA), University of Málaga, 29080 Málaga, Spain.
BIONAND, Centro Andaluz de Nanomedicina y Biotecnología, Junta de Andalucía, Universidad de Málaga, 29590 Málaga, Spain.
Life (Basel). 2021 May 29;11(6):496. doi: 10.3390/life11060496.
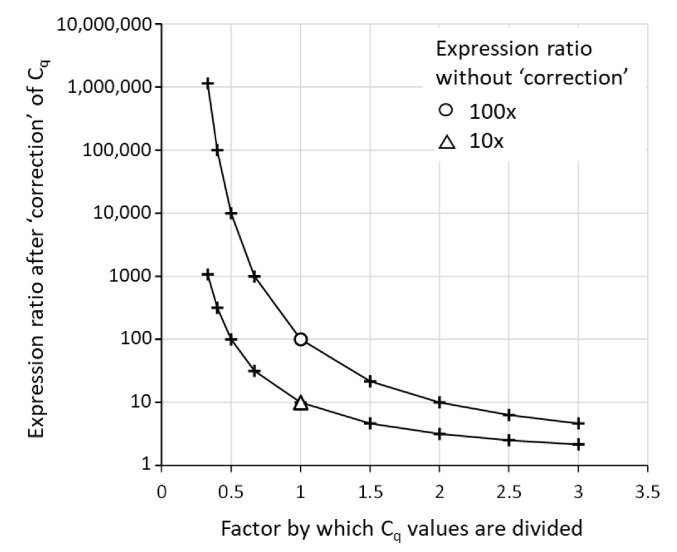
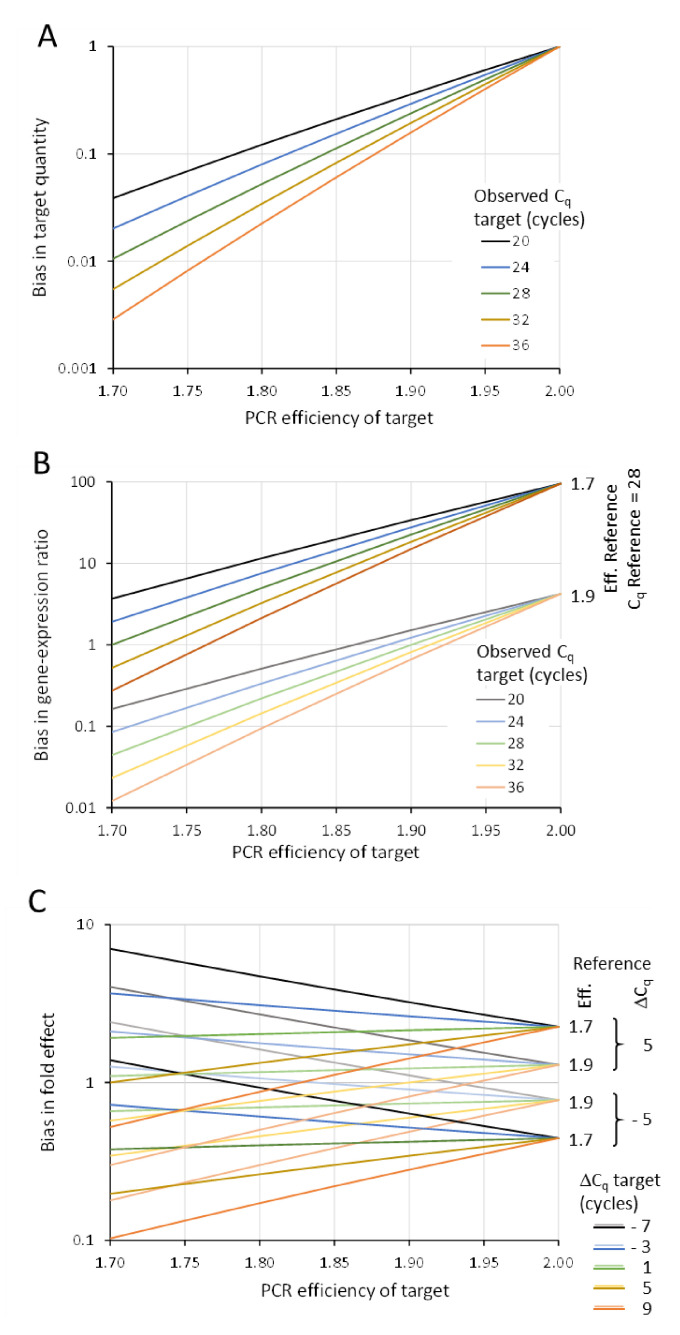
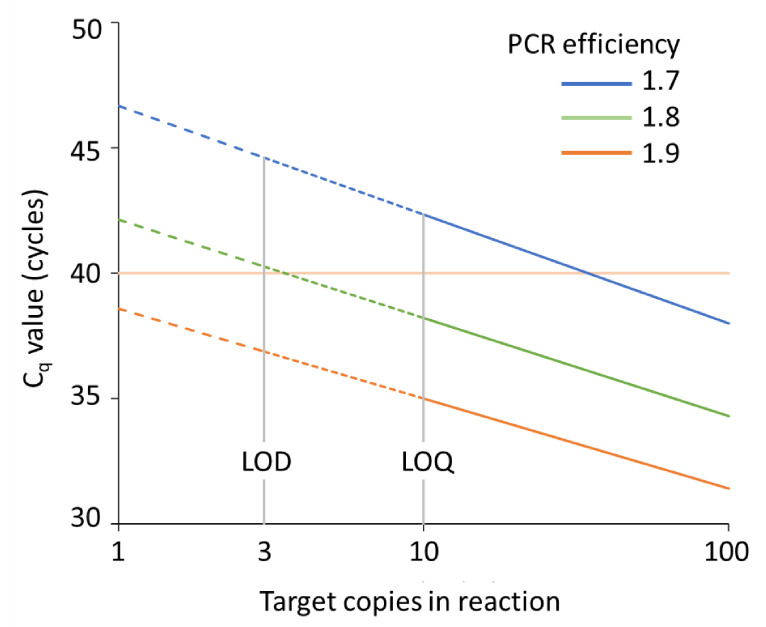
In the analysis of quantitative PCR (qPCR) data, the quantification cycle (C) indicates the position of the amplification curve with respect to the cycle axis. Because C is directly related to the starting concentration of the target, and the difference in C values is related to the starting concentration ratio, the only results of qPCR analysis reported are often C, ΔC or ΔΔC values. However, reporting of C values ignores the fact that C values may differ between runs and machines, and, therefore, cannot be compared between laboratories. Moreover, C values are highly dependent on the PCR efficiency, which differs between assays and may differ between samples. Interpreting reported C values, assuming a 100% efficient PCR, may lead to assumed gene expression ratios that are 100-fold off. This review describes how differences in quantification threshold setting, PCR efficiency, starting material, PCR artefacts, pipetting errors and sampling variation are at the origin of differences and variability in C values and discusses the limits to the interpretation of observed C values. These issues can be avoided by calculating efficiency-corrected starting concentrations per reaction. The reporting of gene expression ratios and fold difference between treatments can then easily be based on these starting concentrations.
在定量聚合酶链反应(qPCR)数据分析中,定量循环数(C)表示扩增曲线相对于循环轴的位置。由于C与靶标的起始浓度直接相关,且C值的差异与起始浓度比有关,因此qPCR分析报告的唯一结果通常是C、ΔC或ΔΔC值。然而,报告C值忽略了这样一个事实,即C值在不同的运行和仪器之间可能存在差异,因此不同实验室之间无法进行比较。此外,C值高度依赖于PCR效率,而PCR效率在不同的检测方法之间以及不同的样本之间可能会有所不同。在假设PCR效率为100%的情况下解释报告的C值,可能会导致假设的基因表达比相差100倍。本综述描述了定量阈值设置、PCR效率、起始材料、PCR假象、移液误差和采样变异等方面的差异如何导致C值的差异和变异性,并讨论了观察到的C值解释的局限性。通过计算每个反应的效率校正起始浓度,可以避免这些问题。然后,基于这些起始浓度,可以轻松报告基因表达比和处理之间的倍数差异。