National Center for Chronic and Non-Communicable Disease Control and Prevention, Chinese Center for Disease Control and Prevention, Beijing, China.
MRC Centre for Environment and Health & Abdul Latif Jameel Institute for Disease and Emergency Analytics, Department of Epidemiology and Biostatistics, School of Public Health, Imperial College London, London, UK.
Lancet. 2021 Jul 3;398(10294):53-63. doi: 10.1016/S0140-6736(21)00798-4.
In China, mean body-mass index (BMI) and obesity in adults have increased steadily since the early 1980s. However, to our knowledge, there has been no reliable assessment of recent trends, nationally, regionally, or in certain population subgroups. To address this evidence gap, we present detailed analyses of relevant data from six consecutive nationally representative health surveys done between 2004 and 2018. We aimed to examine the long-term and recent trends in mean BMI and prevalence of obesity among Chinese adults, with specific emphasis on changes before and after 2010 (when various national non-communicable disease prevention programmes were initiated), assess how these trends might vary by sex, age, urban-rural locality, and socioeconomic status, and estimate the number of people who were obese in 2018 compared with 2004.
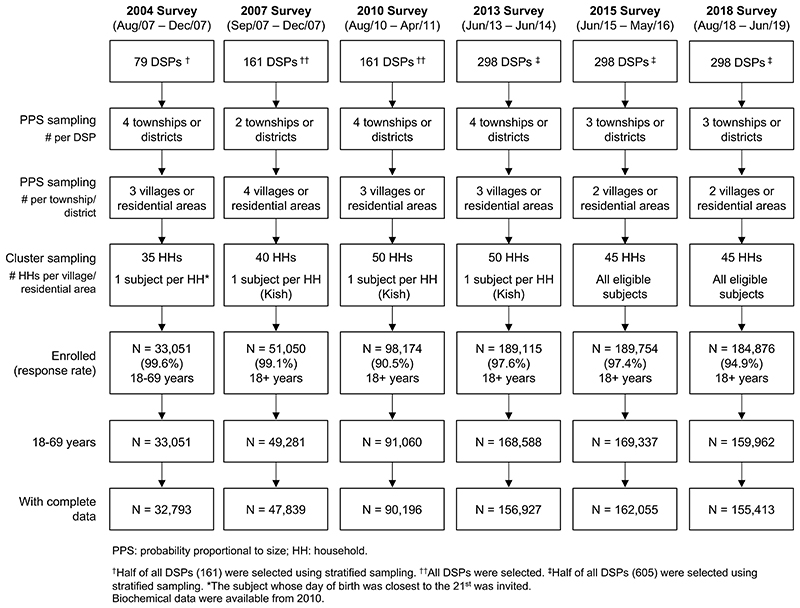
We used data from the China Chronic Disease and Risk Factors Surveillance programme, which was established in 2004 with the aim to provide periodic nationwide data on the prevalence of major chronic diseases and the associated behavioural and metabolic risk factors in the general population. Between 2004 and 2018 six nationally representative surveys were done. 776 571 individuals were invited and 746 020 (96·1%) participated, including 33 051 in 2004, 51 050 in 2007, 98 174 in 2010, 189 115 in 2013, 189 754 in 2015, and 184 876 in 2018. After exclusions, 645 223 participants aged 18-69 years remained for the present analyses. The mean BMI and prevalence of obesity (BMI ≥30 kg/m) were calculated and time trends compared by sex, age, urban-rural locality, geographical region, and socioeconomic status.
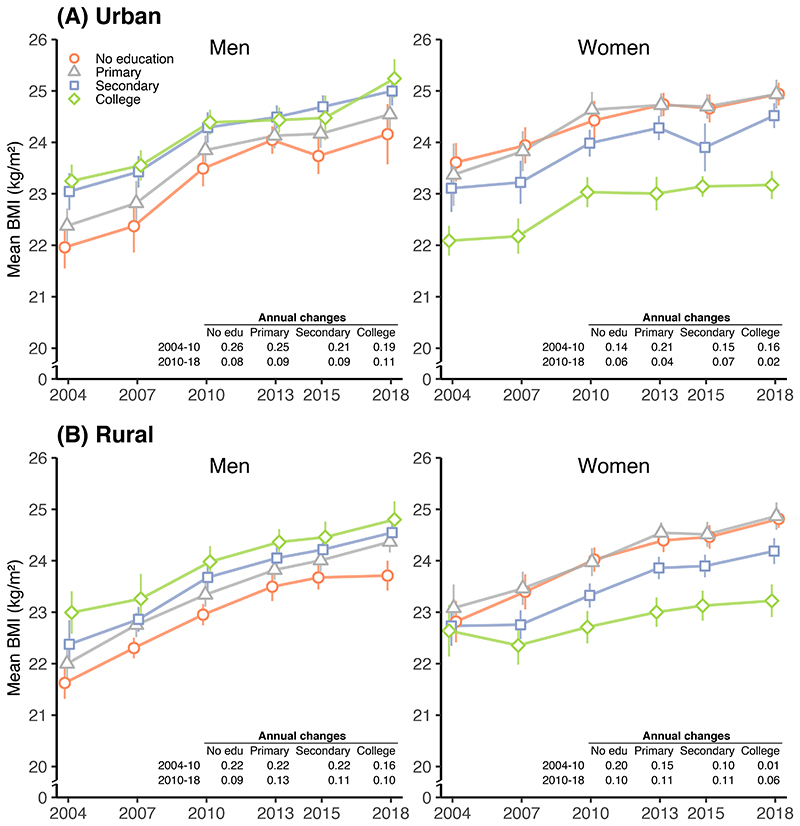
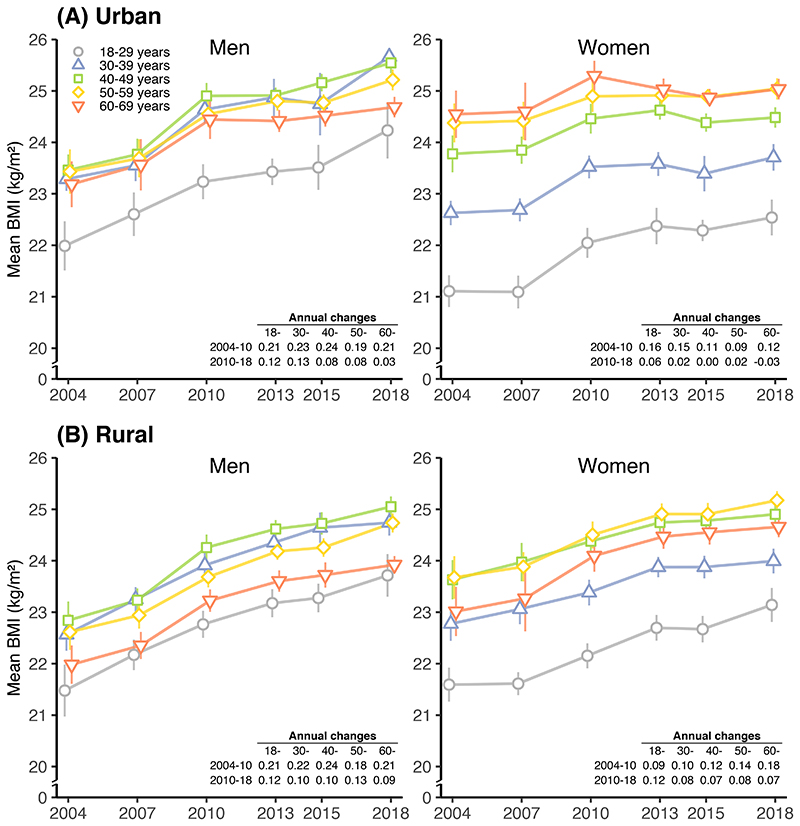
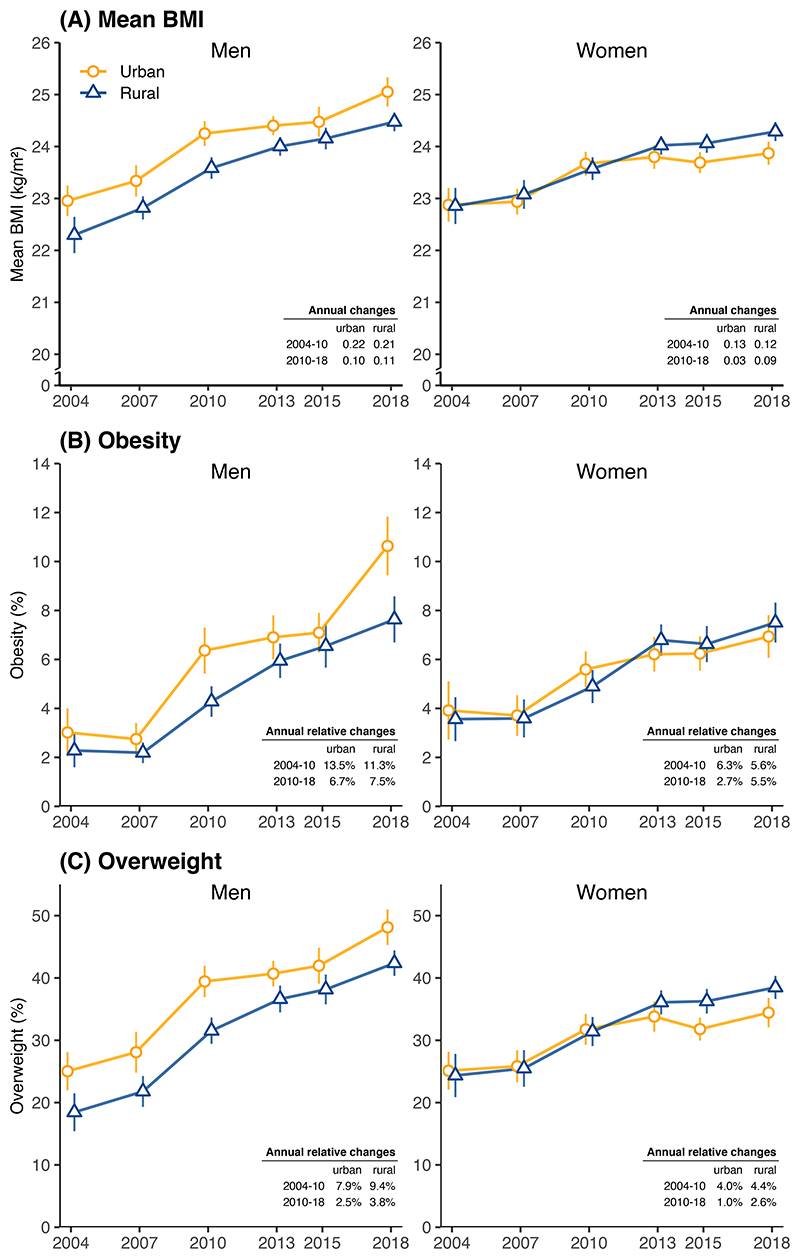
Standardised mean BMI levels rose from 22·7 kg/m (95% CI 22·5-22·9) in 2004 to 24·4 kg/m (24·3-24·6) in 2018 and obesity prevalence from 3·1% (2·5-3·7) to 8·1% (7·6-8·7). Between 2010 and 2018, mean BMI rose by 0·09 kg/m annually (0·06-0·11), which was half of that reported during 2004-10 (0·17 kg/m, 95% CI 0·12-0·22). Similarly, the annual increase in obesity prevalence was somewhat smaller after 2010 than before 2010 (6·0% annual relative increase, 95% CI 4·4-7·6 vs 8·7% annual relative increase, 4·9-12·8; p=0·13). Since 2010, the rise in mean BMI and obesity prevalence has slowed down substantially in urban men and women, and moderately in rural men, but continued steadily in rural women. By 2018, mean BMI was higher in rural than urban women (24·3 kg/mvs 23·9 kg/m; p=0·0045), but remained lower in rural than urban men (24·5 kg/mvs 25·1 kg/m; p=0·0007). Across all six surveys, mean BMI was persistently lower in women with higher levels of education compared with women with lower levels of education, but the inverse was true among men. Overall, an estimated 85 million adults (95% CI 70 million-100 million; 48 million men [95% CI 39 million-57 million] and 37 million women [31 million-43 million]) aged 18-69 years in China were obese in 2018, which was three times as many as in 2004.
In China, the rise in mean BMI among the adult population appears to have slowed down over the past decade. However, we found divergent trends by sex, geographical area, and socioeconomic status, highlighting the need for a more targeted approach to prevent further increases in obesity in the Chinese general population.
China National Key Research and Development Program, China National Key Project of Public Health Program, and Youth Scientific Research Foundation of the National Center for Chronic and Noncommunicable Disease Control and Prevention, Chinese Center for Disease Control and Prevention.
自 20 世纪 80 年代初以来,中国成年人的平均体重指数(BMI)和肥胖率稳步上升。然而,据我们所知,目前还没有关于全国、地区或特定人群亚组的最新趋势的可靠评估。为了解决这一证据差距,我们展示了 2004 年至 2018 年期间进行的六次连续全国代表性健康调查的相关数据的详细分析。我们旨在研究中国成年人的平均 BMI 和肥胖患病率的长期和近期趋势,特别强调 2010 年(各种国家非传染性疾病预防计划开始)前后的变化,评估这些趋势在性别、年龄、城乡地区和社会经济地位方面可能如何变化,并估计 2018 年肥胖人口与 2004 年相比的数量。
我们使用了中国慢性病和危险因素监测计划的数据,该计划于 2004 年成立,旨在提供全国范围内关于一般人群主要慢性病及其相关行为和代谢风险因素流行率的定期数据。在 2004 年至 2018 年期间进行了六次全国代表性调查。邀请了 776571 人,其中 746020 人(96.1%)参加了调查,包括 2004 年的 33115 人、2007 年的 51050 人、2010 年的 98174 人、2013 年的 189115 人、2015 年的 189754 人和 2018 年的 184876 人。经过排除,共有 645223 名 18-69 岁的参与者纳入本分析。按性别、年龄、城乡地区、地理区域和社会经济地位计算平均 BMI 和肥胖患病率(BMI≥30kg/m),并比较时间趋势。
标准化平均 BMI 水平从 2004 年的 22.7kg/m(95%CI 22.5-22.9)上升到 2018 年的 24.4kg/m(24.3-24.6),肥胖患病率从 3.1%(2.5-3.7)上升到 8.1%(7.6-8.7)。2010 年至 2018 年间,平均 BMI 每年增加 0.09kg/m(0.06-0.11),这是 2004-2010 年报告的一半(0.17kg/m,95%CI 0.12-0.22)。同样,2010 年后肥胖患病率的年增长率也小于 2010 年前(6.0%的年相对增长率,95%CI 4.4-7.6 与 8.7%的年相对增长率,95%CI 4.9-12.8;p=0.13)。自 2010 年以来,城市男性和女性的平均 BMI 和肥胖患病率上升速度明显放缓,农村男性的上升速度也有所放缓,但在农村女性中仍在持续上升。到 2018 年,农村女性的平均 BMI 高于城市女性(24.3kg/mvs23.9kg/m;p=0.0045),但仍低于城市男性(24.5kg/mvs25.1kg/m;p=0.0007)。在所有六次调查中,教育水平较高的女性的平均 BMI 一直低于教育水平较低的女性,但男性则相反。总的来说,2018 年中国 18-69 岁的成年人中估计有 8500 万人(95%CI 7000 万-1 亿;4800 万男性[95%CI 3900 万-5700 万]和 3700 万女性[3100 万-4300 万])肥胖,是 2004 年的三倍。
在中国,成年人口的平均 BMI 上升似乎在过去十年中有所放缓。然而,我们发现性别、地理区域和社会经济地位方面存在分歧趋势,这突显出需要采取更有针对性的方法来防止中国一般人群中肥胖率的进一步上升。
中国国家重点研发计划、中国国家重大公共卫生项目和中国疾病预防控制中心慢性非传染性疾病预防控制中心青年科学研究基金。