• 文献检索
  • 文档翻译
  • 深度研究
  • 学术资讯
  • Suppr Zotero 插件Zotero 插件
  • 邀请有礼
  • 套餐&价格
  • 历史记录
应用&插件
Suppr Zotero 插件Zotero 插件浏览器插件Mac 客户端Windows 客户端微信小程序
定价
高级版会员购买积分包购买API积分包
服务
文献检索文档翻译深度研究API 文档MCP 服务
关于我们
关于 Suppr公司介绍联系我们用户协议隐私条款
关注我们

Suppr 超能文献

核心技术专利:CN118964589B侵权必究
粤ICP备2023148730 号-1Suppr @ 2026

文献检索

告别复杂PubMed语法,用中文像聊天一样搜索,搜遍4000万医学文献。AI智能推荐,让科研检索更轻松。

立即免费搜索

文件翻译

保留排版,准确专业,支持PDF/Word/PPT等文件格式,支持 12+语言互译。

免费翻译文档

深度研究

AI帮你快速写综述,25分钟生成高质量综述,智能提取关键信息,辅助科研写作。

立即免费体验

基于每周死亡率数据的主成分分析评估大流行时期的超额死亡率——以COVID-19为例

Assessing excess mortality in times of pandemics based on principal component analysis of weekly mortality data-the case of COVID-19.

作者信息

Vanella Patrizio, Basellini Ugofilippo, Lange Berit

机构信息

Department of Epidemiology, Helmholtz Centre for Infection Research (HZI), Inhoffenstr. 7, DE-38124 Brunswick, Germany.

Chair of Empirical Methods in Social Science and Demography, University of Rostock, Ulmenstr. 69, DE-18057 Rostock, Germany.

出版信息

Genus. 2021;77(1):16. doi: 10.1186/s41118-021-00123-9. Epub 2021 Aug 9.

DOI:10.1186/s41118-021-00123-9
PMID:34393261
原文链接:https://pmc.ncbi.nlm.nih.gov/articles/PMC8350559/
Abstract

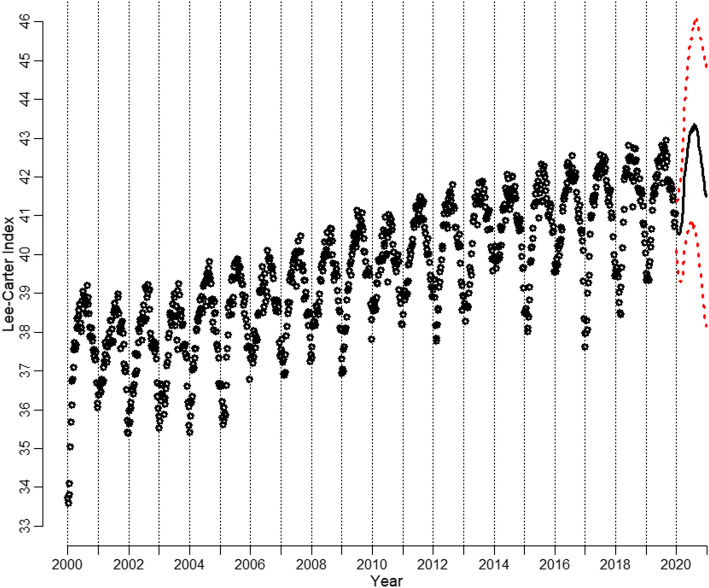
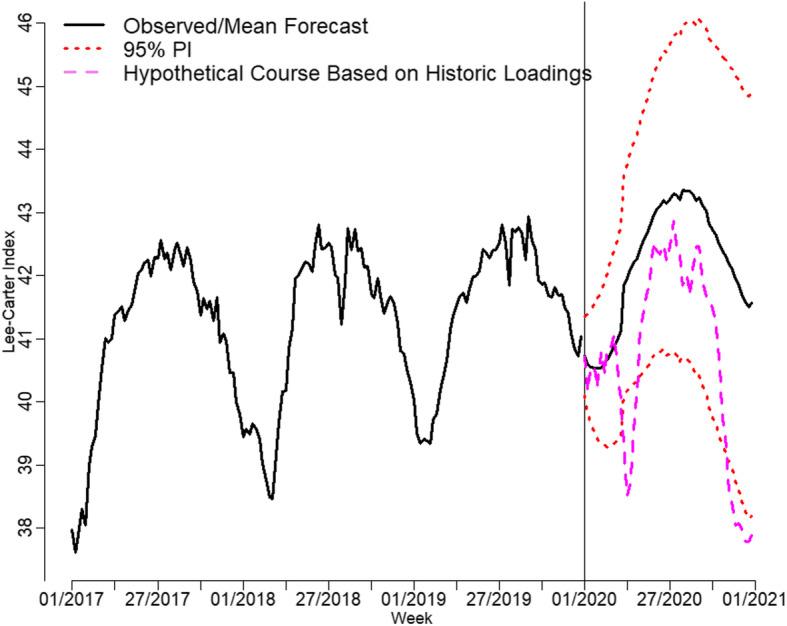
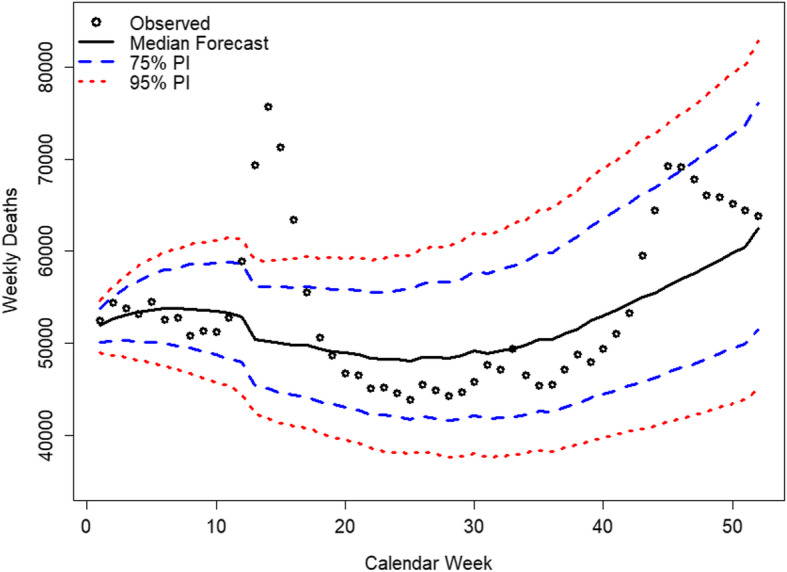
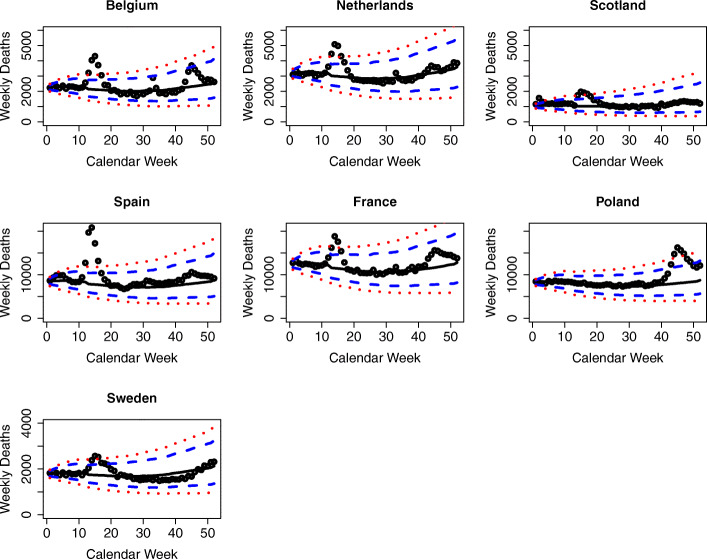
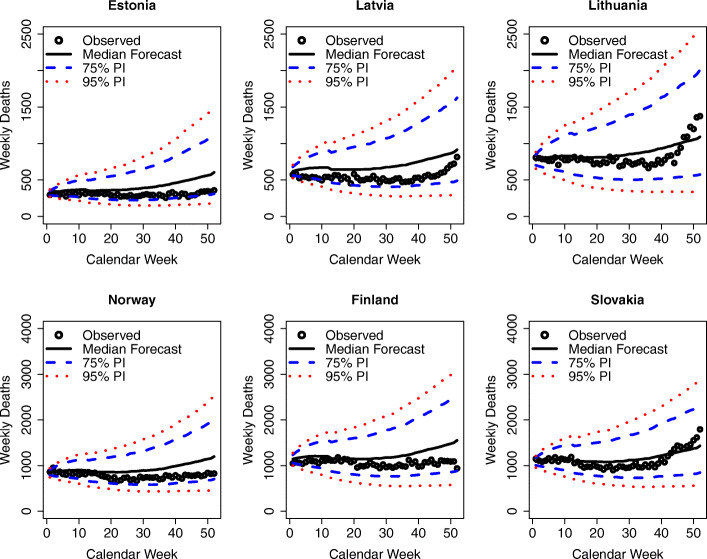
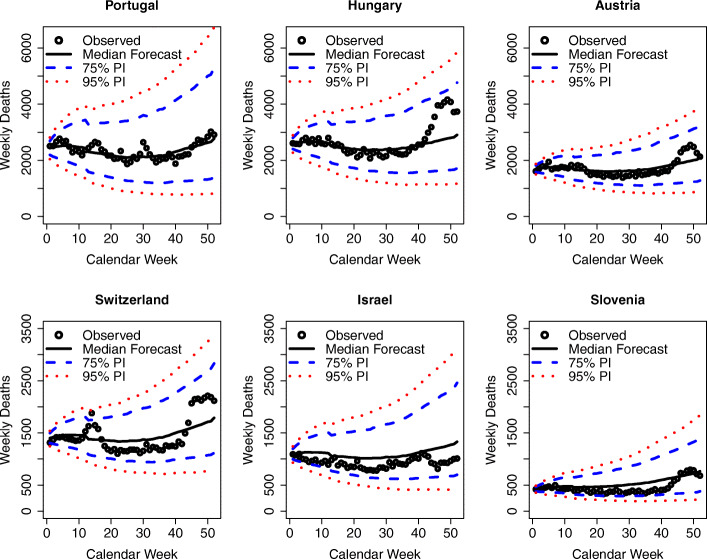
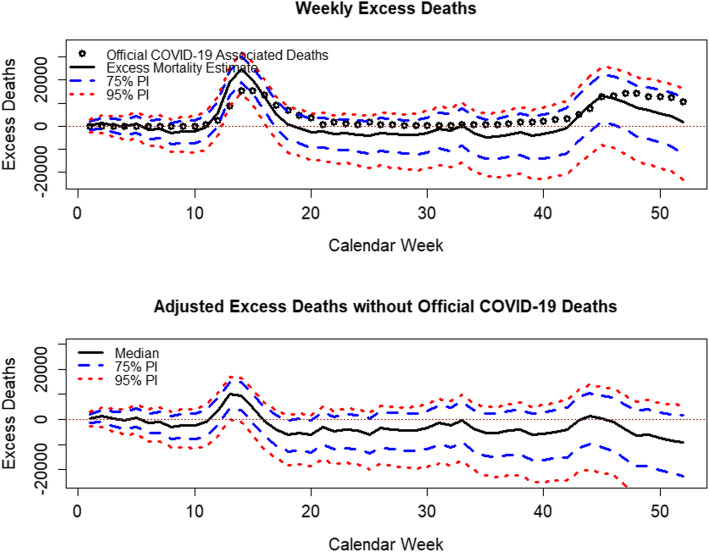
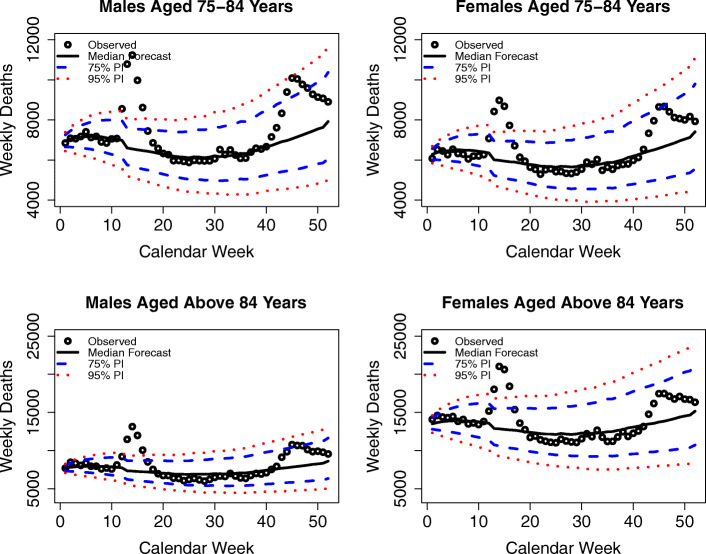
The COVID-19 outbreak has called for renewed attention to the need for sound statistical analyses to monitor mortality patterns and trends over time. Excess mortality has been suggested as the most appropriate indicator to measure the overall burden of the pandemic in terms of mortality. As such, excess mortality has received considerable interest since the outbreak of COVID-19 began. Previous approaches to estimate excess mortality are somewhat limited, as they do not include sufficiently long-term trends, correlations among different demographic and geographic groups, or autocorrelations in the mortality time series. This might lead to biased estimates of excess mortality, as random mortality fluctuations may be misinterpreted as excess mortality. We propose a novel approach that overcomes the named limitations and draws a more realistic picture of excess mortality. Our approach is based on an established forecasting model that is used in demography, namely, the Lee-Carter model. We illustrate our approach by using the weekly age- and sex-specific mortality data for 19 countries and the current COVID-19 pandemic as a case study. Our findings show evidence of considerable excess mortality during 2020 in Europe, which affects different countries, age, and sex groups heterogeneously. Our proposed model can be applied to future pandemics as well as to monitor excess mortality from specific causes of death.

摘要

新冠疫情促使人们重新关注对死亡率模式和长期趋势进行可靠统计分析的必要性。超额死亡率被认为是衡量该疫情在死亡率方面总体负担的最合适指标。因此,自新冠疫情爆发以来,超额死亡率受到了广泛关注。以往估计超额死亡率的方法存在一定局限性,因为它们没有纳入足够长的长期趋势、不同人口和地理群体之间的相关性,或死亡率时间序列中的自相关性。这可能导致对超额死亡率的估计产生偏差,因为随机的死亡率波动可能被误判为超额死亡率。我们提出了一种新颖的方法,克服了上述局限性,更真实地描绘了超额死亡率情况。我们的方法基于人口统计学中一种既定的预测模型,即李-卡特模型。我们以19个国家按年龄和性别的每周死亡率数据以及当前的新冠疫情为例,阐述我们的方法。我们的研究结果表明,2020年欧洲存在相当程度的超额死亡率,不同国家、年龄和性别群体受到的影响存在差异。我们提出的模型可应用于未来的疫情,也可用于监测特定死因导致的超额死亡率。

https://cdn.ncbi.nlm.nih.gov/pmc/blobs/40a0/8350559/d9b7410f0863/41118_2021_123_Fig17_HTML.jpg
https://cdn.ncbi.nlm.nih.gov/pmc/blobs/40a0/8350559/c18320feda66/41118_2021_123_Fig1_HTML.jpg
https://cdn.ncbi.nlm.nih.gov/pmc/blobs/40a0/8350559/b35acd0d98f7/41118_2021_123_Fig2_HTML.jpg
https://cdn.ncbi.nlm.nih.gov/pmc/blobs/40a0/8350559/e9f497cb4699/41118_2021_123_Fig3_HTML.jpg
https://cdn.ncbi.nlm.nih.gov/pmc/blobs/40a0/8350559/5c0e94e8226c/41118_2021_123_Fig4_HTML.jpg
https://cdn.ncbi.nlm.nih.gov/pmc/blobs/40a0/8350559/e03166f5496f/41118_2021_123_Fig5_HTML.jpg
https://cdn.ncbi.nlm.nih.gov/pmc/blobs/40a0/8350559/cb7171a2037a/41118_2021_123_Fig6_HTML.jpg
https://cdn.ncbi.nlm.nih.gov/pmc/blobs/40a0/8350559/952bfcae0e4a/41118_2021_123_Fig7_HTML.jpg
https://cdn.ncbi.nlm.nih.gov/pmc/blobs/40a0/8350559/a3f330a4cc91/41118_2021_123_Fig8_HTML.jpg
https://cdn.ncbi.nlm.nih.gov/pmc/blobs/40a0/8350559/75a221d5584c/41118_2021_123_Fig9_HTML.jpg
https://cdn.ncbi.nlm.nih.gov/pmc/blobs/40a0/8350559/a0cba819c84c/41118_2021_123_Fig10_HTML.jpg
https://cdn.ncbi.nlm.nih.gov/pmc/blobs/40a0/8350559/1067e99e40a6/41118_2021_123_Fig11_HTML.jpg
https://cdn.ncbi.nlm.nih.gov/pmc/blobs/40a0/8350559/86ec7e4d9845/41118_2021_123_Fig12_HTML.jpg
https://cdn.ncbi.nlm.nih.gov/pmc/blobs/40a0/8350559/a4a273bd0c55/41118_2021_123_Fig13_HTML.jpg
https://cdn.ncbi.nlm.nih.gov/pmc/blobs/40a0/8350559/6c563fa4e653/41118_2021_123_Fig14_HTML.jpg
https://cdn.ncbi.nlm.nih.gov/pmc/blobs/40a0/8350559/909bc6a6c1bc/41118_2021_123_Fig15_HTML.jpg
https://cdn.ncbi.nlm.nih.gov/pmc/blobs/40a0/8350559/d0e523dfb6bf/41118_2021_123_Fig16_HTML.jpg
https://cdn.ncbi.nlm.nih.gov/pmc/blobs/40a0/8350559/d9b7410f0863/41118_2021_123_Fig17_HTML.jpg

相似文献

1
Assessing excess mortality in times of pandemics based on principal component analysis of weekly mortality data-the case of COVID-19.基于每周死亡率数据的主成分分析评估大流行时期的超额死亡率——以COVID-19为例
Genus. 2021;77(1):16. doi: 10.1186/s41118-021-00123-9. Epub 2021 Aug 9.
2
Population age structure dependency of the excess mortality P-score.人口年龄结构对超额死亡率 P 评分的依赖性。
Popul Health Metr. 2024 Sep 27;22(1):25. doi: 10.1186/s12963-024-00346-w.
3
Estimating excess mortality due to the COVID-19 pandemic: a systematic analysis of COVID-19-related mortality, 2020-21.估算2019冠状病毒病大流行造成的超额死亡率:2020 - 2021年与2019冠状病毒病相关死亡率的系统分析
Lancet. 2022 Apr 16;399(10334):1513-1536. doi: 10.1016/S0140-6736(21)02796-3. Epub 2022 Mar 10.
4
What should be the baseline when calculating excess mortality? New approaches suggest that we have underestimated the impact of the COVID-19 pandemic and previous winter peaks.计算超额死亡率时的基线应该是什么?新方法表明,我们低估了新冠疫情及此前冬季高峰的影响。
SSM Popul Health. 2022 Jun;18:101118. doi: 10.1016/j.ssmph.2022.101118. Epub 2022 May 6.
5
Excess death estimates from multiverse analysis in 2009-2021.2009-2021 年多元宇宙分析得出的超额死亡估计数。
Eur J Epidemiol. 2023 Nov;38(11):1129-1139. doi: 10.1007/s10654-023-00998-2. Epub 2023 Apr 12.
6
The COVID-19 pandemic's true death toll in Iran after two years: an interrupted time series analysis of weekly all-cause mortality data.两年后伊朗 COVID-19 大流行的真实死亡人数:对每周全因死亡率数据的中断时间序列分析。
BMC Public Health. 2023 Mar 7;23(1):442. doi: 10.1186/s12889-023-15336-0.
7
Excess mortality during the COVID-19 outbreak in Italy: a two-stage interrupted time-series analysis.意大利 COVID-19 疫情期间的超额死亡率:两阶段中断时间序列分析。
Int J Epidemiol. 2021 Jan 23;49(6):1909-1917. doi: 10.1093/ije/dyaa169.
8
Temporal variation of excess deaths from diabetes during the COVID-19 pandemic in the United States.美国 COVID-19 大流行期间糖尿病超额死亡的时间变化。
J Infect Public Health. 2023 Apr;16(4):483-489. doi: 10.1016/j.jiph.2023.01.018. Epub 2023 Jan 25.
9
Inequalities in excess premature mortality in England during the COVID-19 pandemic: a cross-sectional analysis of cumulative excess mortality by area deprivation and ethnicity.英格兰在 COVID-19 大流行期间超额过早死亡率的不平等:按地区贫困程度和种族划分的累积超额死亡率的横断面分析。
BMJ Open. 2021 Dec 23;11(12):e052646. doi: 10.1136/bmjopen-2021-052646.
10
Excess death among Latino people in California during the COVID-19 pandemic.新冠疫情期间加利福尼亚州拉丁裔人群的超额死亡情况。
medRxiv. 2021 Jan 25:2020.12.18.20248434. doi: 10.1101/2020.12.18.20248434.

引用本文的文献

1
Excess mortality and years of life lost from 2020 to 2023 in France: a cohort study of the overall impact of the COVID-19 pandemic on mortality.2020年至2023年法国的超额死亡率和生命损失年数:一项关于新冠疫情对死亡率总体影响的队列研究
BMJ Public Health. 2025 Mar 4;3(1):e001836. doi: 10.1136/bmjph-2024-001836. eCollection 2025 Jan.
2
Data from Emergency Medical Service Activities: A Novel Approach to Monitoring COVID-19 and Other Infectious Diseases.紧急医疗服务活动数据:监测新冠病毒及其他传染病的新方法
Diagnostics (Basel). 2025 Jan 14;15(2):181. doi: 10.3390/diagnostics15020181.
3
An Interrupted Time Series Analysis of the Impact of the COVID-19 Pandemic on Routine Vaccination Uptake in Kenya.

本文引用的文献

1
Quantifying impacts of the COVID-19 pandemic through life-expectancy losses: a population-level study of 29 countries.通过预期寿命损失量化 COVID-19 大流行的影响:对 29 个国家的人口水平研究。
Int J Epidemiol. 2022 Feb 18;51(1):63-74. doi: 10.1093/ije/dyab207.
2
The impact of government measures and human mobility trend on COVID-19 related deaths in the UK.政府措施和人员流动趋势对英国新冠相关死亡病例的影响。
Transp Res Interdiscip Perspect. 2020 Jul;6:100167. doi: 10.1016/j.trip.2020.100167. Epub 2020 Jul 4.
3
Excess deaths associated with covid-19 pandemic in 2020: age and sex disaggregated time series analysis in 29 high income countries.
对新冠疫情对肯尼亚常规疫苗接种影响的中断时间序列分析。
Vaccines (Basel). 2024 Jul 23;12(8):826. doi: 10.3390/vaccines12080826.
4
Estimation and probabilistic projection of age- and sex-specific mortality rates across Brazilian municipalities between 2010 and 2030.估算和概率预测 2010 年至 2030 年期间巴西各城市的年龄和性别特异性死亡率。
Popul Health Metr. 2024 May 27;22(1):9. doi: 10.1186/s12963-024-00329-x.
5
The spread in time and space of COVID-19 pandemic waves: the Italian experience from mortality data analyses.COVID-19 大流行波在时间和空间上的传播:意大利从死亡率数据分析中得到的经验。
Front Public Health. 2024 Feb 28;12:1324033. doi: 10.3389/fpubh.2024.1324033. eCollection 2024.
6
Excess mortality among people with communicable diseases over a 30-year period, Victoria, Australia: a whole of population cohort study.澳大利亚维多利亚州30年间传染病患者的超额死亡率:一项全人群队列研究
Lancet Reg Health West Pac. 2023 Jun 20;38:100815. doi: 10.1016/j.lanwpc.2023.100815. eCollection 2023 Sep.
7
No Excess of Mortality from Lung Cancer during the COVID-19 Pandemic in an Area at Environmental Risk: Results of an Explorative Analysis.在一个环境风险地区,COVID-19 大流行期间肺癌死亡率没有增加:一项探索性分析的结果。
Int J Environ Res Public Health. 2023 Apr 14;20(8):5522. doi: 10.3390/ijerph20085522.
8
Assessment of Excess Mortality in Italy in 2020-2021 as a Function of Selected Macro-Factors.评估 2020-2021 年意大利因选定宏观因素导致的超额死亡率。
Int J Environ Res Public Health. 2023 Feb 5;20(4):2812. doi: 10.3390/ijerph20042812.
9
The challenge of estimating the direct and indirect effects of COVID-19 interventions - Toward an integrated economic and epidemiological approach.估算 COVID-19 干预措施的直接和间接影响的挑战 - 迈向综合经济和流行病学方法。
Econ Hum Biol. 2023 Apr;49:101198. doi: 10.1016/j.ehb.2022.101198. Epub 2022 Nov 8.
10
Real-time mortality statistics during the COVID-19 pandemic: A proposal based on Spanish data, January-March, 2021.COVID-19 大流行期间的实时死亡率统计:基于西班牙 2021 年 1 月至 3 月数据的建议。
Front Public Health. 2022 Nov 8;10:950469. doi: 10.3389/fpubh.2022.950469. eCollection 2022.
2020 年与新冠大流行相关的超额死亡人数:29 个高收入国家按年龄和性别细分的时间序列分析。
BMJ. 2021 May 19;373:n1137. doi: 10.1136/bmj.n1137.
4
An open-sourced, web-based application to analyze weekly excess mortality based on the Short-term Mortality Fluctuations data series.一个开源的、基于网络的应用程序,用于根据短期死亡率波动数据系列分析每周超额死亡率。
PLoS One. 2021 Feb 5;16(2):e0246663. doi: 10.1371/journal.pone.0246663. eCollection 2021.
5
Impact of non-pharmaceutical interventions targeted at COVID-19 pandemic on influenza burden - a systematic review.针对 COVID-19 大流行的非药物干预措施对流感负担的影响 - 系统评价。
J Infect. 2021 Jan;82(1):1-35. doi: 10.1016/j.jinf.2020.11.039. Epub 2020 Dec 3.
6
Magnitude, demographics and dynamics of the effect of the first wave of the COVID-19 pandemic on all-cause mortality in 21 industrialized countries.新冠大流行第一波对 21 个工业化国家全因死亡率影响的规模、人口统计学特征和动态。
Nat Med. 2020 Dec;26(12):1919-1928. doi: 10.1038/s41591-020-1112-0. Epub 2020 Oct 14.
7
Monitoring trends and differences in COVID-19 case-fatality rates using decomposition methods: Contributions of age structure and age-specific fatality.使用分解方法监测 COVID-19 病死率的趋势和差异:年龄结构和特定年龄病死率的贡献。
PLoS One. 2020 Sep 10;15(9):e0238904. doi: 10.1371/journal.pone.0238904. eCollection 2020.
8
A country level analysis measuring the impact of government actions, country preparedness and socioeconomic factors on COVID-19 mortality and related health outcomes.一项国家级分析,衡量政府行动、国家准备情况和社会经济因素对新冠肺炎死亡率及相关健康结果的影响。
EClinicalMedicine. 2020 Aug;25:100464. doi: 10.1016/j.eclinm.2020.100464. Epub 2020 Jul 21.
9
Demographic perspectives on the mortality of COVID-19 and other epidemics.人口统计学视角下的 COVID-19 和其他传染病的死亡率。
Proc Natl Acad Sci U S A. 2020 Sep 8;117(36):22035-22041. doi: 10.1073/pnas.2006392117. Epub 2020 Aug 20.
10
Common Pitfalls in the Interpretation of COVID-19 Data and Statistics.新型冠状病毒肺炎(COVID-19)数据解读与统计中的常见陷阱
Inter Econ. 2020;55(3):162-166. doi: 10.1007/s10272-020-0893-1. Epub 2020 Jun 7.