Campbell Patrick C, Tong Daniel, Tang Youhua, Baker Barry, Lee Pius, Saylor Rick, Stein Ariel, Ma Siqi, Lamsal Lok, Qu Zhen
Center for Spatial Information Science and Systems, Cooperative Institute for Satellite Earth System Studies, George Mason University, Fairfax, VA, USA.
Office of Oceanic and Atmospheric Research, Air Resources Laboratory, National Oceanic and Atmospheric Administration, College Park, MD, USA.
Atmos Environ (1994). 2021 Nov 1;264:118713. doi: 10.1016/j.atmosenv.2021.118713. Epub 2021 Sep 4.
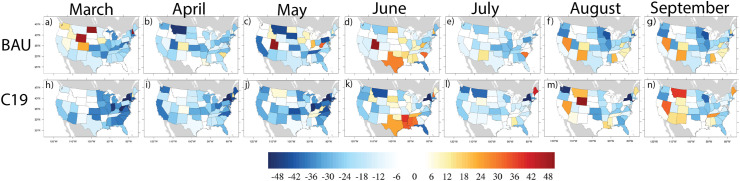
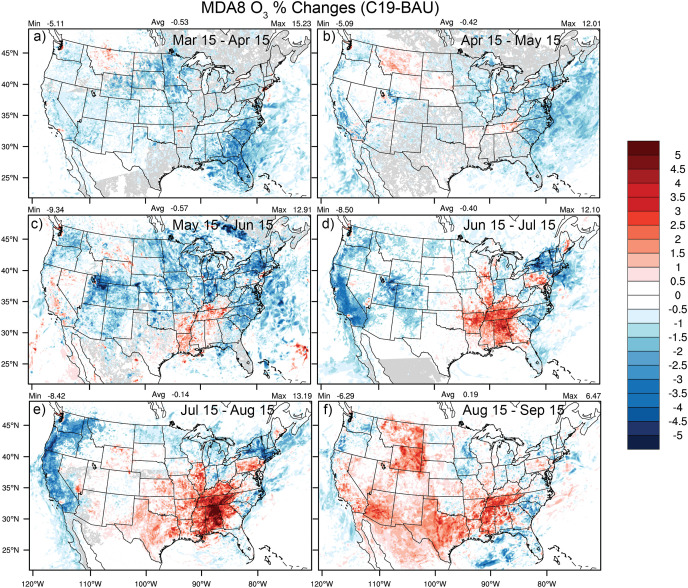
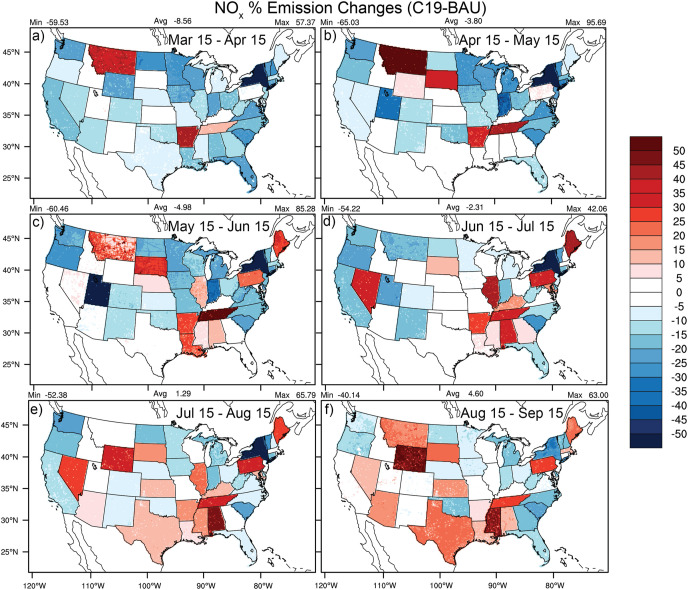
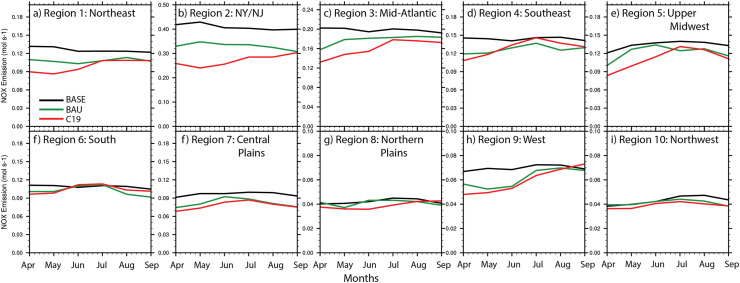
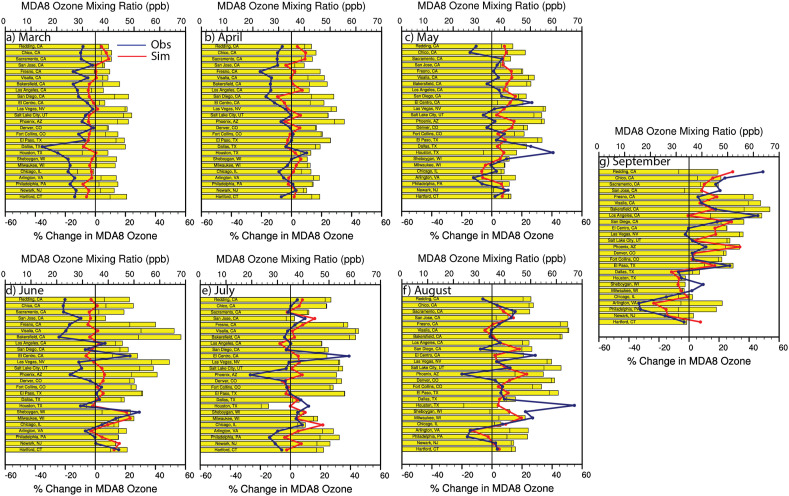
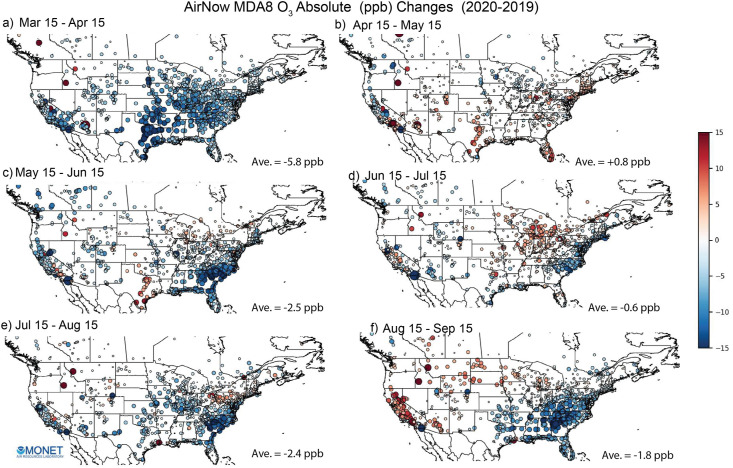
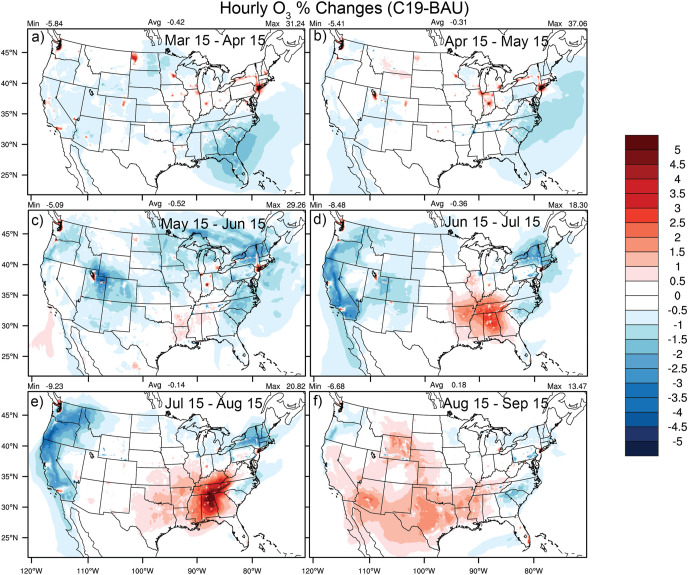
In this work, we use observations and experimental emissions in a version of NOAA's National Air Quality Forecasting Capability to show that the COVID-19 economic slowdown led to disproportionate impacts on near-surface ozone concentrations across the contiguous U.S. (CONUS). The data-fusion methodology used here includes both U.S. EPA Air Quality System ground and the NASA Aura satellite Ozone Monitoring Instrument (OMI) NO observations to infer the representative emissions changes due to the COVID-19 economic slowdown in the U.S. Results show that there were widespread decreases in anthropogenic (e.g., NO) emissions in the U.S. during March-June 2020, which led to widespread decreases in ozone concentrations in the rural regions that are NO-limited, but also some localized increases near urban centers that are VOC-limited. Later in June-September, there were smaller decreases, and potentially some relative increases in NO emissions for many areas of the U.S. (e.g., south-southeast) that led to more extensive increases in ozone concentrations that are partly in agreement with observations. The widespread NO emissions changes also alters the O photochemical formation regimes, most notably the NO emissions decreases in March-April, which can enhance (mitigate) the NO-limited (VOC-limited) regimes in different regions of CONUS. The average of all AirNow hourly O changes for 2020-2019 range from about +1 to -4 ppb during March-September, and are associated with predominantly urban monitoring sites that demonstrate considerable spatiotemporal variability for the 2020 ozone changes compared to the previous five years individually (2015-2019). The simulated maximum values of the average O changes for March-September range from about +8 to -4 ppb (or +40 to -10%). Results of this work have implications for the use of widespread controls of anthropogenic emissions, particularly those from mobile sources, used to curb ozone pollution under the current meteorological and climate conditions in the U.S.
在这项工作中,我们在NOAA的国家空气质量预测能力的一个版本中使用观测数据和实验排放数据,以表明新冠疫情导致的经济放缓对美国本土(CONUS)近地表臭氧浓度产生了不成比例的影响。这里使用的数据融合方法包括美国环保署空气质量系统地面监测数据以及美国国家航空航天局(NASA)奥拉卫星的臭氧监测仪器(OMI)的二氧化氮(NO)观测数据,以推断出因美国新冠疫情导致的经济放缓而产生的代表性排放变化。结果表明,2020年3月至6月期间,美国人为(如NO)排放普遍减少,这导致了NO受限的农村地区臭氧浓度普遍下降,但在VOC受限的城市中心附近也出现了一些局部增加。在6月至9月晚些时候,排放量减少幅度较小,美国许多地区(如东南部)的NO排放量可能出现了一些相对增加,这导致臭氧浓度更广泛地增加,这在一定程度上与观测结果一致。广泛的NO排放变化也改变了O的光化学形成机制,最显著的是3月至4月NO排放量的减少,这可以增强(减轻)美国不同地区的NO受限(VOC受限)机制。2020年3月至9月期间,与2015 - 2019年这五年各自相比,2020年臭氧变化的所有AirNow每小时O变化平均值在约 +1至 -4 ppb之间,且主要与城市监测站点相关,这些站点显示出相当大的时空变异性。3月至9月平均O变化的模拟最大值在约 +8至 -4 ppb之间(或 +40%至 -10%)。这项工作的结果对于在美国当前气象和气候条件下,使用广泛的人为排放控制措施,特别是来自移动源的排放控制措施来抑制臭氧污染具有启示意义。