Athena Institute, VU University Amsterdam, Amsterdam, Netherlands.
KEMRI/Wellcome Trust Research Programme, Nairobi, Kenya.
BMC Health Serv Res. 2021 Sep 24;21(1):1010. doi: 10.1186/s12913-021-07030-x.
Job aids such as observation charts are commonly used to record inpatient nursing observations. For sick newborns, it is important to provide critical information, intervene, and tailor treatment to improve health outcomes, as countries work towards reducing neonatal mortality. However, inpatient vital sign readings are often poorly documented and little attention has been paid to the process of chart design as a method of improving care quality. Poorly designed charts do not meet user needs leading to increased mental effort, duplication, suboptimal documentation and fragmentation. We provide a detailed account of a process of designing a monitoring chart.
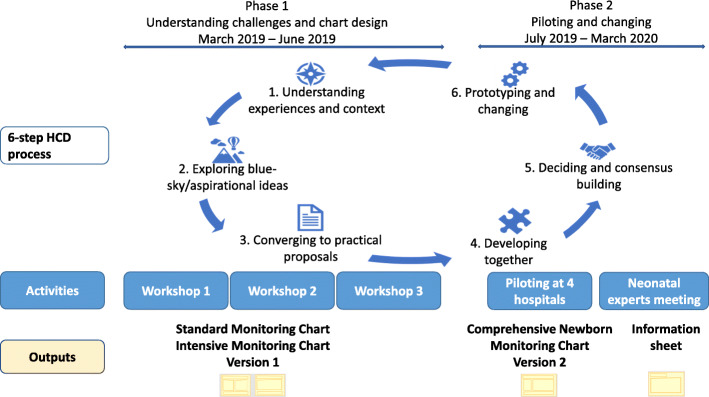
We used a Human-Centred Design (HCD) approach to co-design a newborn monitoring chart between March and May 2019 in three workshops attended by 16-21 participants each (nurses and doctors) drawn from 14 hospitals in Kenya. We used personas, user story mapping during the workshops and observed chart completion to identify challenges with current charts and design requirements. Two new charts were piloted in four hospitals between June 2019 and February 2020 and revised in a cyclical manner.
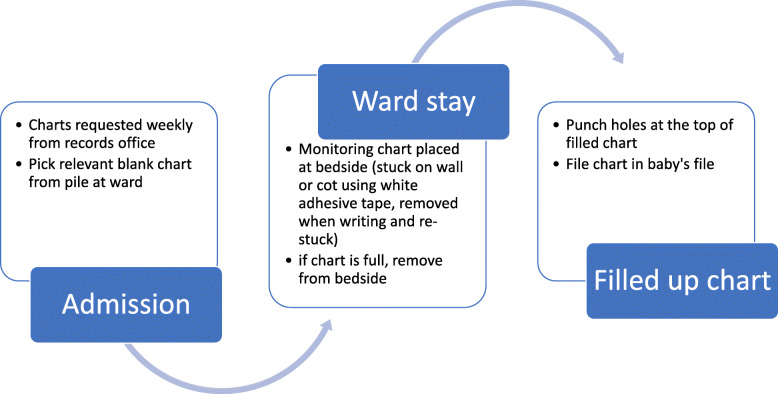
Challenges were identified regarding the chart design and supply, and how staff used existing charts. Challenges to use included limited staffing, a knowledge deficit among junior staff, poor interprofessional communication, and lack of appropriate and working equipment. We identified a strong preference from participants for one chart to capture vital signs, assessment of the baby, and feed and fluid prescription and monitoring; data that were previously captured on several charts.
Adopting a Human-Centred Design approach, we designed a new comprehensive newborn monitoring chart that is unlike observation charts in the literature that only focus on vital signs. While the new chart does not address all needs, we believe that once implemented, it can help build a clearer picture of the care given to newborns.
The chart was co-designed and piloted with the user and context in mind resulting in a unique monitoring chart that can be adopted in similar settings.
观察图表等工作辅助工具常用于记录住院护理观察结果。对于患病新生儿,提供关键信息、进行干预并调整治疗以改善健康结果至关重要,因为各国都在努力降低新生儿死亡率。然而,住院生命体征读数的记录往往很差,而且很少有人关注图表设计过程作为提高护理质量的方法。设计不佳的图表无法满足用户需求,导致精神投入增加、重复、记录不完整和碎片化。我们详细介绍了设计监测图表的过程。
我们于 2019 年 3 月至 5 月期间使用以人为中心的设计(HCD)方法在三次研讨会上共同设计新生儿监测图表,每次研讨会有 16-21 名参与者参加(护士和医生),来自肯尼亚的 14 家医院。我们使用人物角色、用户故事映射,并在研讨会上观察图表完成情况,以确定当前图表和设计要求存在的挑战。2019 年 6 月至 2020 年 2 月期间,在四家医院对两张新图表进行了试点,并进行了循环修订。
在图表设计和供应以及员工如何使用现有图表方面发现了挑战。使用方面的挑战包括人员配备有限、初级员工知识不足、专业间沟通不畅以及缺乏适当和可用的设备。参与者强烈倾向于使用一张图表来记录生命体征、婴儿评估、喂养和液体处方以及监测数据;这些数据以前是在几张图表上记录的。
我们采用以人为中心的设计方法设计了一种新的综合新生儿监测图表,与文献中仅关注生命体征的观察图表不同。虽然新图表并不能满足所有需求,但我们相信,一旦实施,它可以帮助更清晰地了解新生儿的护理情况。
该图表是在考虑用户和背景的情况下共同设计和试点的,因此产生了一种独特的监测图表,可以在类似环境中采用。