Wijeratne Peter A, Garbarino Sara, Gregory Sarah, Johnson Eileanoir B, Scahill Rachael I, Paulsen Jane S, Tabrizi Sarah J, Lorenzi Marco, Alexander Daniel C
Centre for Medical Image Computing (P.A.W., D.C.A.), Department of Computer Science, University College London, Gower Street; Huntington's Disease Research Centre (P.A.W., S. Gregory, E.B.J., R.I.S., S.J.T.), Department of Neurodegenerative Disease, University College London, Queen Square Institute of Neurology, London, United Kingdom; Dipartimento di Matematica (S. Garbarino), UNIGE, DIMA, Genova, Italy; Departments of Neurology and Psychiatry (J.S.P.), Carver College of Medicine, University of Iowa; and Université Côte d'Azur (M.L.), Inria, Epione Research Project, Valbonne, France.
Neurol Genet. 2021 Oct 12;7(5):e617. doi: 10.1212/NXG.0000000000000617. eCollection 2021 Oct.
Longitudinal measurements of brain atrophy using structural MRI (sMRI) can provide powerful markers for tracking disease progression in neurodegenerative diseases. In this study, we use a disease progression model to learn individual-level disease times and hence reveal a new timeline of sMRI changes in Huntington disease (HD).
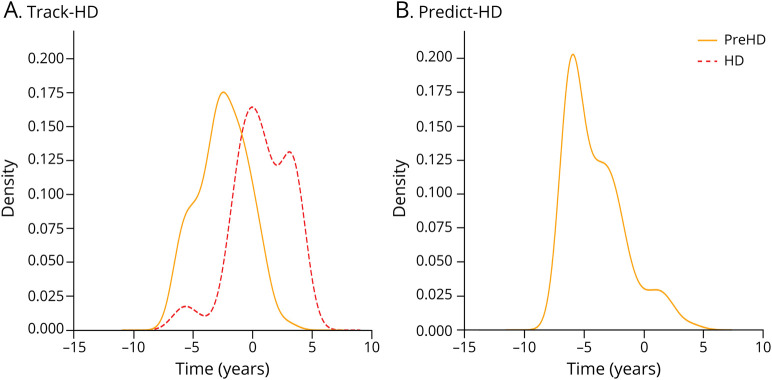
We use data from the 2 largest cohort imaging studies in HD-284 participants from TRACK-HD (100 control, 104 premanifest, and 80 manifest) and 159 participants from PREDICT-HD (36 control and 128 premanifest)-to train and test the model. We longitudinally register T1-weighted sMRI scans from 3 consecutive time points to reduce intraindividual variability and calculate regional brain volumes using an automated segmentation tool with rigorous manual quality control.
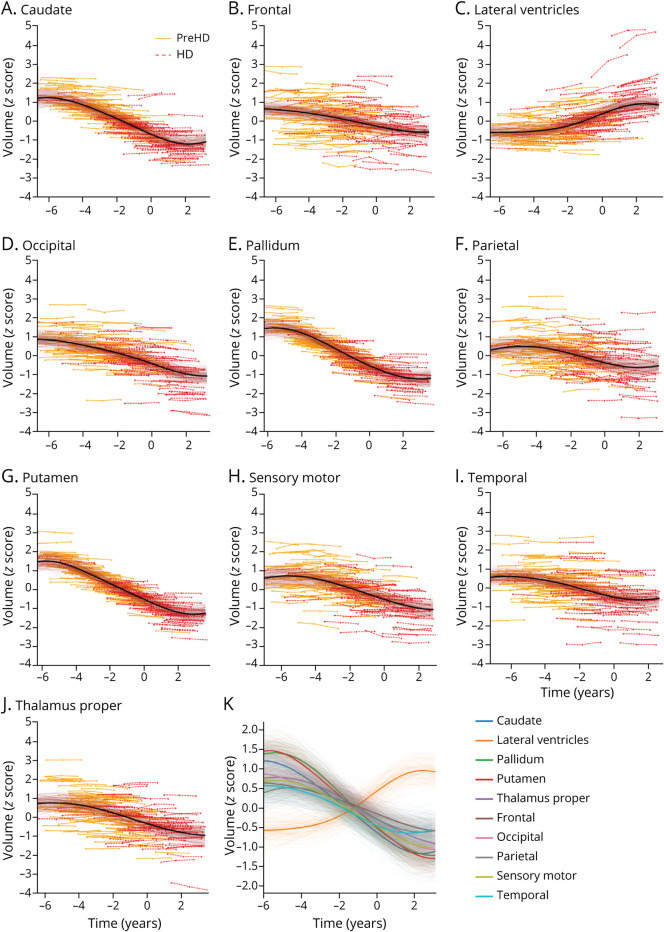
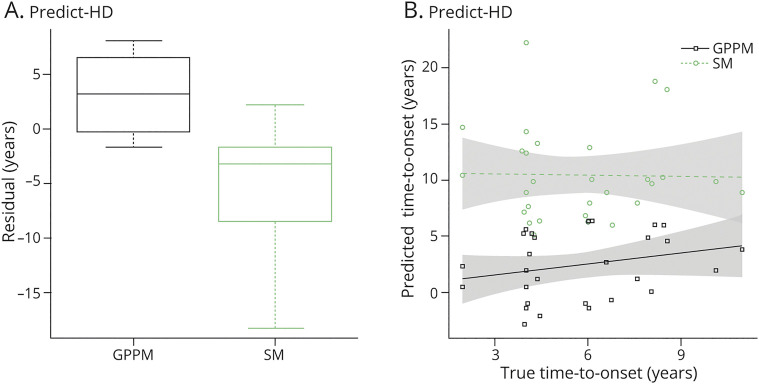
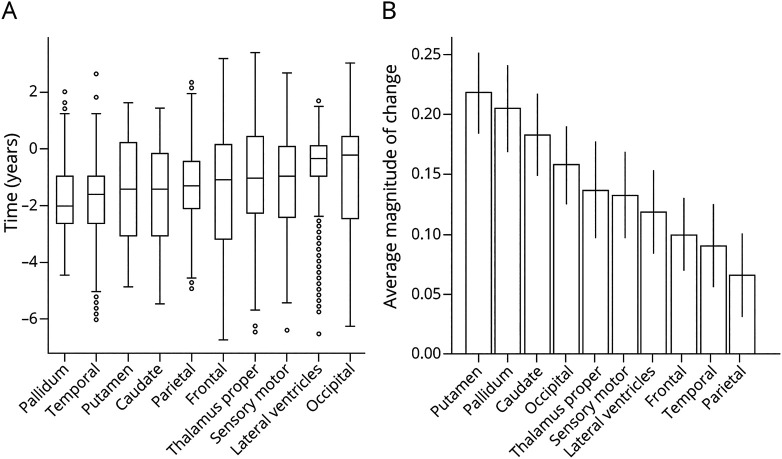
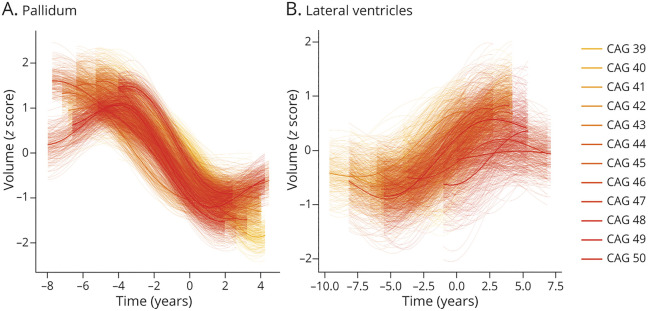
Our model reveals, for the first time, the relative magnitude and timescale of subcortical and cortical atrophy changes in HD. We find that the largest (∼20% average change in magnitude) and earliest (∼2 years before average abnormality) changes occur in the subcortex (pallidum, putamen, and caudate), followed by a cascade of changes across other subcortical and cortical regions over a period of ∼11 years. We also show that sMRI, when combined with our disease progression model, provides improved prediction of onset over the current best method (root mean square error = 4.5 years and maximum error = 7.9 years vs root mean square error = 6.6 years and maximum error = 18.2 years).
Our findings support the use of disease progression modeling to reveal new information from sMRI, which can potentially inform imaging marker selection for clinical trials.
使用结构磁共振成像(sMRI)对脑萎缩进行纵向测量可为追踪神经退行性疾病的疾病进展提供有力的标志物。在本研究中,我们使用一种疾病进展模型来了解个体水平的疾病时间,从而揭示亨廷顿病(HD)中sMRI变化的新时间线。
我们使用来自HD领域两项最大队列成像研究的数据——来自TRACK-HD研究的284名参与者(100名对照者、104名临床前患者和80名临床患者)以及来自PREDICT-HD研究的159名参与者(36名对照者和128名临床前患者)——来训练和测试该模型。我们对连续3个时间点的T1加权sMRI扫描进行纵向配准,以减少个体内变异性,并使用具有严格人工质量控制的自动分割工具计算脑区体积。
我们的模型首次揭示了HD患者皮质下和皮质萎缩变化的相对幅度和时间尺度。我们发现,最大(平均变化幅度约20%)且最早(平均异常前约2年)的变化发生在皮质下(苍白球、壳核和尾状核),随后在约11年的时间里,其他皮质下和皮质区域出现一系列变化。我们还表明,当sMRI与我们的疾病进展模型相结合时,与当前最佳方法相比,对发病的预测有所改善(均方根误差 = 4.5年,最大误差 = 7.9年;相比之下,当前最佳方法的均方根误差 = 6.6年,最大误差 = 18.2年)。
我们的研究结果支持使用疾病进展模型从sMRI中揭示新信息,这可能为临床试验的成像标志物选择提供参考。