Baloglu Orkun, Nagy Matthew, Ezetendu Chidiebere, Latifi Samir Q, Nazha Aziz
Pediatric Critical Care Medicine, Cleveland Clinic Children's, Cleveland, OH.
Cleveland Clinic Children`s Center for Artificial Intelligence (C4AI), Cleveland, OH.
Crit Care Explor. 2021 Oct 19;3(10):e0561. doi: 10.1097/CCE.0000000000000561. eCollection 2021 Oct.
Pediatric Index of Mortality 3 is a validated tool including 11 variables for the assessment of mortality risk in PICU patients. With the recent advances in explainable machine learning algorithms, we aimed to assess feasibility of application of these machine learning models to simplify the Pediatric Index of Mortality 3 scoring system in order to decrease time and labor required for data collection and entry for Pediatric Index of Mortality 3.
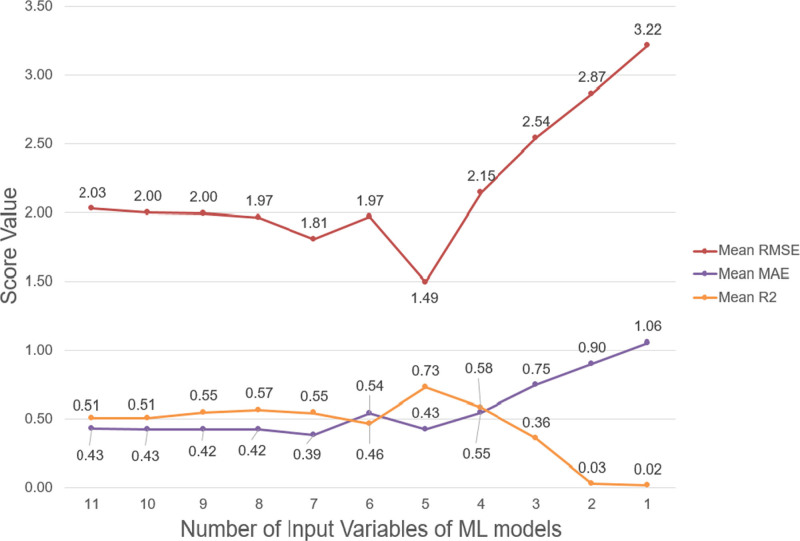
Single-center, retrospective cohort study. Data from the Virtual Pediatric Systems for patients admitted to Cleveland Clinic Children`s PICU between January 2008 and December 2019 was obtained. Light Gradient Boosting Machine Regressor (a gradient boosting decision tree algorithm) was used for building the machine learning models. Variable importance was analyzed by SHapley Additive exPlanations. All of the 11 Pediatric Index of Mortality 3 variables were used as input variables in the machine learning models to predict Pediatric Index of Mortality 3 risk of mortality as the outcome variable. Mean absolute error, root mean squared error, and R-squared were calculated for each of the 11 machine learning models as model performance parameters.
Quaternary children's hospital.
PICU patients.
None.
Five-thousand sixty-eight patients were analyzed. The machine learning models were able to maintain similar predictive error until the number of input variables decreased to four. The machine learning model with five input variables (mechanical ventilation in the first hour of PICU admission, very-high-risk diagnosis, surgical recovery from a noncardiac procedure, low-risk diagnosis, and base excess) produced lowest mean root mean squared error of 1.49 (95% CI, 1.05-1.93) and highest R-squared of 0.73 (95% CI, 0.6-0.86) with mean absolute error of 0.43 (95% CI, 0.35-0.5) among all the 11 machine learning models.
Explainable machine learning methods were feasible in simplifying the Pediatric Index of Mortality 3 scoring system with similar risk of mortality predictions compared to the original Pediatric Index of Mortality 3 model tested in a single-center dataset.
儿童死亡率指数3是一种经过验证的工具,包含11个变量,用于评估儿科重症监护病房(PICU)患者的死亡风险。随着可解释机器学习算法的最新进展,我们旨在评估应用这些机器学习模型简化儿童死亡率指数3评分系统的可行性,以减少儿童死亡率指数3数据收集和录入所需的时间和人力。
单中心回顾性队列研究。获取了2008年1月至2019年12月期间入住克利夫兰诊所儿童医院PICU的患者的虚拟儿科系统数据。使用轻梯度提升机回归器(一种梯度提升决策树算法)构建机器学习模型。通过夏普利值加法解释(SHapley Additive exPlanations)分析变量重要性。将所有11个儿童死亡率指数3变量用作机器学习模型的输入变量,以预测儿童死亡率指数3的死亡风险作为结果变量。计算11个机器学习模型中每个模型的平均绝对误差、均方根误差和决定系数R²作为模型性能参数。
四级儿童医院。
PICU患者。
无。
分析了5068例患者。直到输入变量数量减少到4个,机器学习模型都能够保持相似的预测误差。在所有11个机器学习模型中,具有5个输入变量(PICU入院后第一小时的机械通气、极高风险诊断、非心脏手术的手术恢复、低风险诊断和碱剩余)的机器学习模型产生的最低均方根误差为1.49(95%CI,1.05 - 1.93),最高决定系数R²为0.73(95%CI,0.6 - 0.86),平均绝对误差为0.43(95%CI,0.35 - 0.5)。
与在单中心数据集中测试的原始儿童死亡率指数3模型相比,可解释机器学习方法在简化儿童死亡率指数3评分系统方面是可行的,且具有相似的死亡风险预测能力。