Messori Andrea
Health Technology Assessment (HTA) Unit, Regione Toscana, Firenze, ITA.
Cureus. 2021 Nov 9;13(11):e19422. doi: 10.7759/cureus.19422. eCollection 2021 Nov.
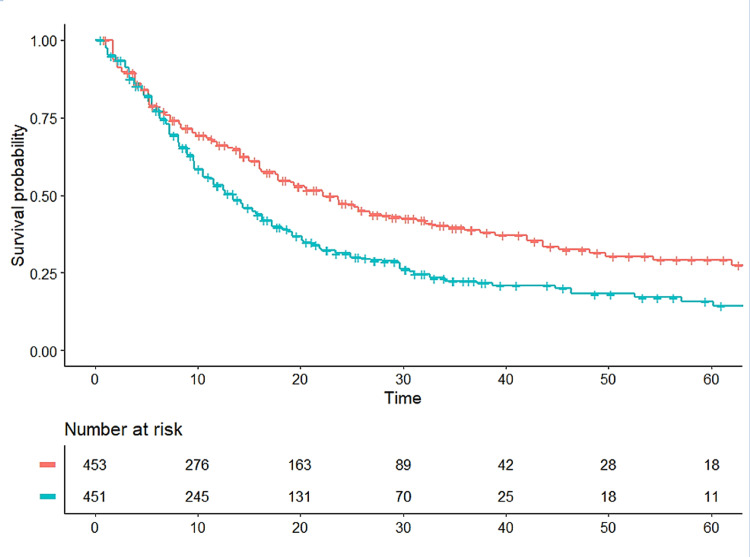
Introduction In conducting a survival meta-analysis, the typical methodological approach analyses the hazard ratios (HRs) of individual trials and then combines them into a pooled meta-analytical estimate. The length of follow-up of individual trials is not generally accounted for. Recent techniques aimed at individual patient-data reconstruction from Kaplan-Meier graphs represent an important methodological innovation. These techniques permit the combination of the survival curves published in a single clinical trial but are also applicable to more than one trial. In the case of multiple trials, a meta-analysis can be conducted without using any statistical model of meta-analysis. Methods As an example of this new approach, we applied a technique of individual patient data reconstruction to the Kaplan-Meier graphs of overall survival reported in two phase-III trials, which were conducted on patients with locally advanced/advanced non-small cell lung cancer selected according to their PD-L1 expression status, not previously treated for their metastatic disease. Only subjects with PD-L1 ≥50% were considered for our analysis. The experimental arms received pembrolizumab monotherapy while the control arms were given platinum-based chemotherapy. The survival graphs were obtained for both trials. For each Kaplan-Meier curve, the graph was firstly digitalized. Then, the Shiny package was used to reconstruct patient-level data. Finally, the pooled survival curves were generated from the reconstructed patient-level data along with the relevant Cox statistics; for this purpose, we used three packages ("coxph", "survfit", and "ggsurvplot") under the R-platform. Results In our pooled analysis based on this procedure, we compared 453 patients given pembrolizumab vs. 451 controls given chemotherapy. The HR estimated from reconstructed patient-level data was 0.670 (95% confidence interval [CI], 0.566 to 0.793). Conclusion The analysis described herein demonstrates the easy applicability of the Shiny technique. This technique was successful in generating a pooled survival graph for the experimental treatment groups vs. controls and efficiently estimated the pooled HR in which the results of the two trials were combined.
引言 在进行生存荟萃分析时,典型的方法是分析各个试验的风险比(HR),然后将它们合并为一个汇总的荟萃分析估计值。各个试验的随访时间通常未被考虑在内。最近旨在从Kaplan-Meier图重建个体患者数据的技术代表了一项重要的方法创新。这些技术允许合并单个临床试验中公布的生存曲线,但也适用于多个试验。在多个试验的情况下,可以在不使用任何荟萃分析统计模型的情况下进行荟萃分析。
方法 作为这种新方法的一个例子,我们将个体患者数据重建技术应用于两项III期试验报告的总生存Kaplan-Meier图,这两项试验针对根据其PD-L1表达状态选择的局部晚期/晚期非小细胞肺癌患者进行,这些患者之前未接受过转移性疾病治疗。我们的分析仅考虑PD-L1≥50%的受试者。试验组接受帕博利珠单抗单药治疗,而对照组给予铂类化疗。两项试验均获得了生存图。对于每条Kaplan-Meier曲线,首先将图数字化。然后,使用Shiny软件包重建患者水平的数据。最后,从重建的患者水平数据以及相关的Cox统计量生成汇总生存曲线;为此,我们在R平台下使用了三个软件包(“coxph”、“survfit”和“ggsurvplot”)。
结果 在基于此程序的汇总分析中,我们比较了453例接受帕博利珠单抗治疗的患者与451例接受化疗的对照组患者。从重建的患者水平数据估计的HR为0.670(95%置信区间[CI],0.566至0.793)。
结论 本文所述的分析证明了Shiny技术易于应用。该技术成功地为试验治疗组与对照组生成了汇总生存图,并有效地估计了合并两项试验结果的汇总HR。