Nicholas School of the Environment, Duke University, Durham, North Carolina, United States of America.
IUCN, Gland, Switzerland.
PLoS One. 2021 Nov 24;16(11):e0259299. doi: 10.1371/journal.pone.0259299. eCollection 2021.
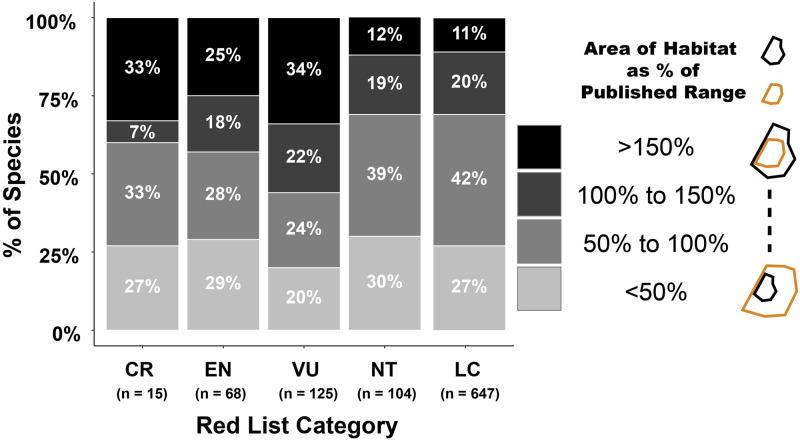
Accurate maps of species ranges are essential to inform conservation, but time-consuming to produce and update. Given the pace of change of knowledge about species distributions and shifts in ranges under climate change and land use, a need exists for timely mapping approaches that enable batch processing employing widely available data. We develop a systematic approach of batch-processing range maps and derived Area of Habitat maps for terrestrial bird species with published ranges below 125,000 km2 in Central and South America. (Area of Habitat is the habitat available to a species within its range.) We combine existing range maps with the rapidly expanding crowd-sourced eBird data of presences and absences from frequently surveyed locations, plus readily accessible, high resolution satellite data on forest cover and elevation to map the Area of Habitat available to each species. Users can interrogate the maps produced to see details of the observations that contributed to the ranges. Previous estimates of Areas of Habitat were constrained within the published ranges and thus were, by definition, smaller-typically about 30%. This reflects how little habitat within suitable elevation ranges exists within the published ranges. Our results show that on average, Areas of Habitat are 12% larger than published ranges, reflecting the often-considerable extent that eBird records expand the known distributions of species. Interestingly, there are substantial differences between threatened and non-threatened species. Some 40% of Critically Endangered, 43% of Endangered, and 55% of Vulnerable species have Areas of Habitat larger than their published ranges, compared with 31% for Near Threatened and Least Concern species. The important finding for conservation is that threatened species are generally more widespread than previously estimated.
准确的物种分布范围图对于指导保护工作至关重要,但制作和更新这些地图需要耗费大量时间。考虑到物种分布知识以及气候变化和土地利用下的分布范围变化的变化速度,需要有一种及时的制图方法,能够批量处理广泛可用的数据。我们开发了一种系统的方法,用于批量处理中美洲和南美洲的陆地鸟类物种的分布范围图和衍生的栖息地面积图,这些物种的分布范围小于 125,000 平方公里。(栖息地面积是物种在其分布范围内可利用的栖息地。)我们将现有的分布范围图与快速扩展的众包 eBird 数据相结合,这些数据记录了经常调查地点的存在和缺失情况,加上易于获取的、高分辨率的森林覆盖和海拔卫星数据,以绘制每个物种的可用栖息地面积图。用户可以查询生成的地图,查看有助于确定分布范围的观测结果的详细信息。以前对栖息地面积的估计是在已发表的范围内进行的,因此,根据定义,其面积较小-通常约为 30%。这反映了在已发表的范围内,适宜海拔范围内存在的栖息地是多么有限。我们的研究结果表明,平均而言,栖息地面积比已发表的范围大 12%,这反映了 eBird 记录在很大程度上扩展了物种的已知分布范围。有趣的是,受威胁物种和非受威胁物种之间存在显著差异。大约 40%的极危物种、43%的濒危物种和 55%的易危物种的栖息地面积大于其已发表的范围,而近危物种和最不关心物种的比例为 31%。对保护工作而言,重要的发现是受威胁物种的分布范围通常比以前估计的要广。