Department of Radiological Technology, National Cancer Center Japan, Tokyo, Japan.
AlgoMedica, Inc., Sunnyvale, California, USA.
Med Phys. 2022 Jan;49(1):186-200. doi: 10.1002/mp.15382. Epub 2021 Dec 15.
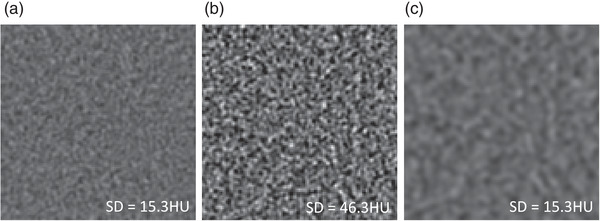
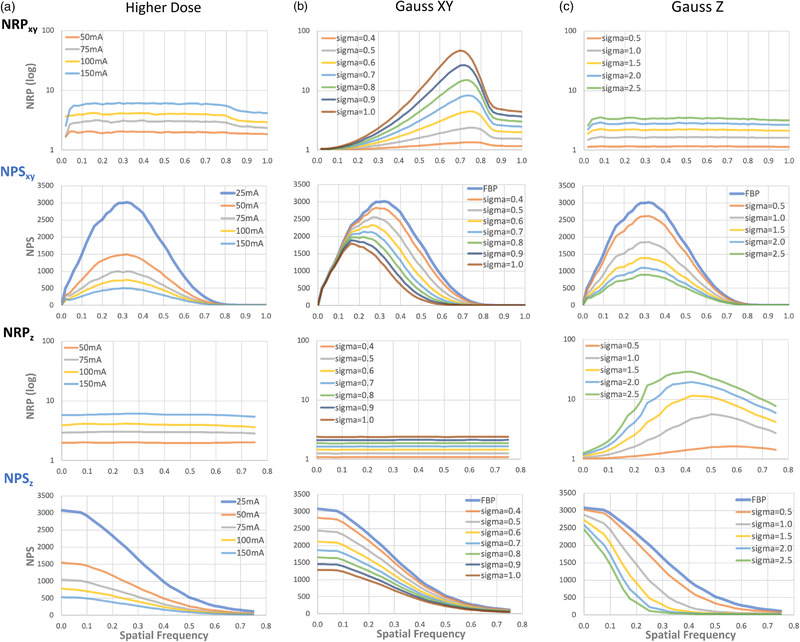
Noise power spectrum (NPS) is a commonly used performance metric to evaluate noise-reduction techniques (NRT) in imaging systems. The images reconstructed with and without an NRT can be compared via their NPS to better understand the NRT's effects on image noise. However, when comparing NPSs, simple visual assessments or a comparison of NPS peaks or medians are often used. These assessments make it difficult to objectively evaluate the effect of noise reduction across all spatial frequencies. In this work, we propose a new noise reduction profile (NRP) to facilitate a more complete and objective evaluation of NPSs for a range of NRTs used specifically in computed tomography (CT).
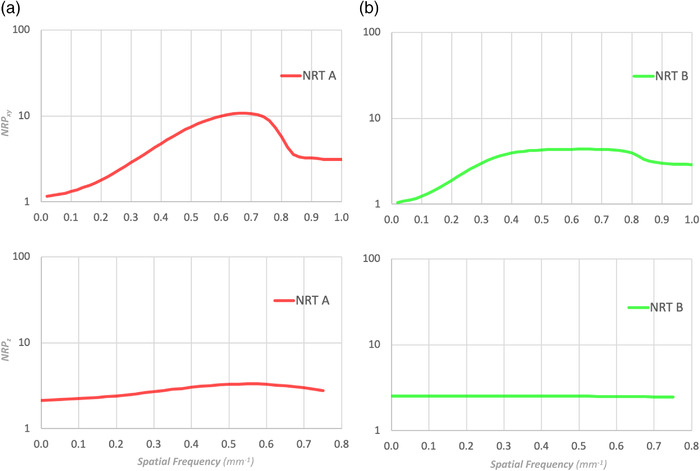
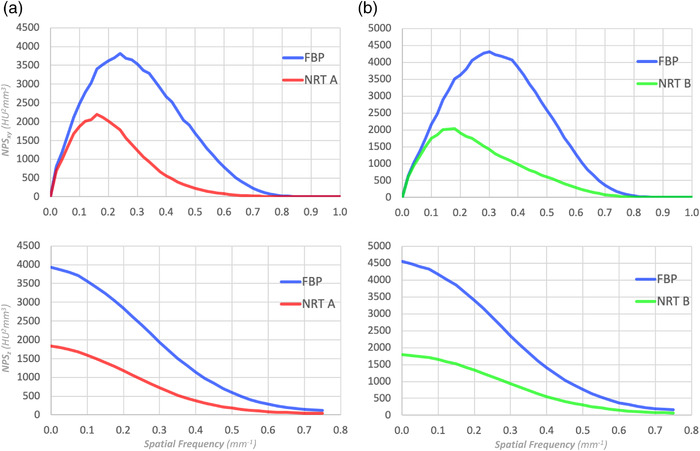
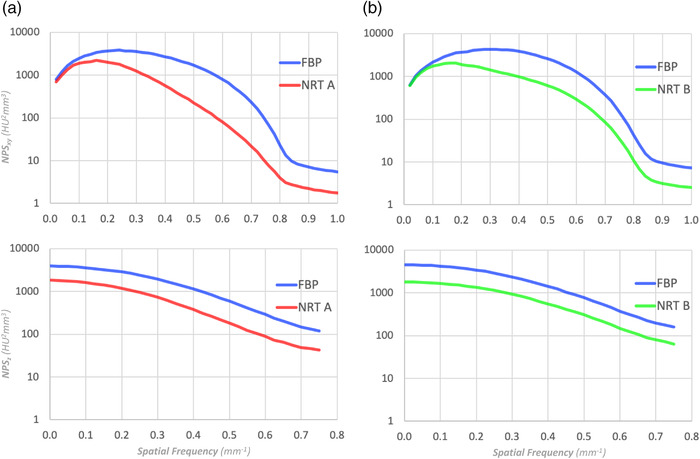
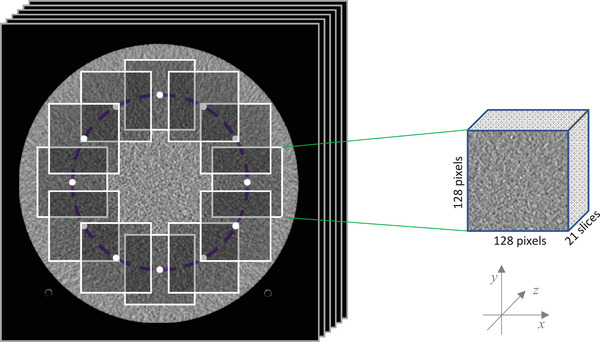
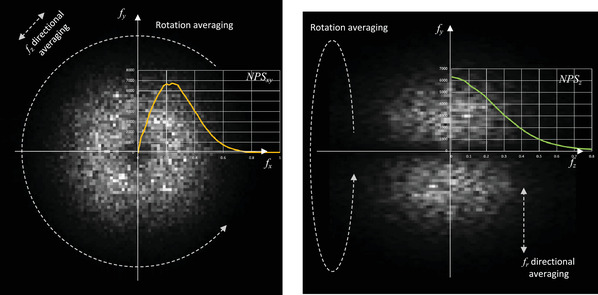
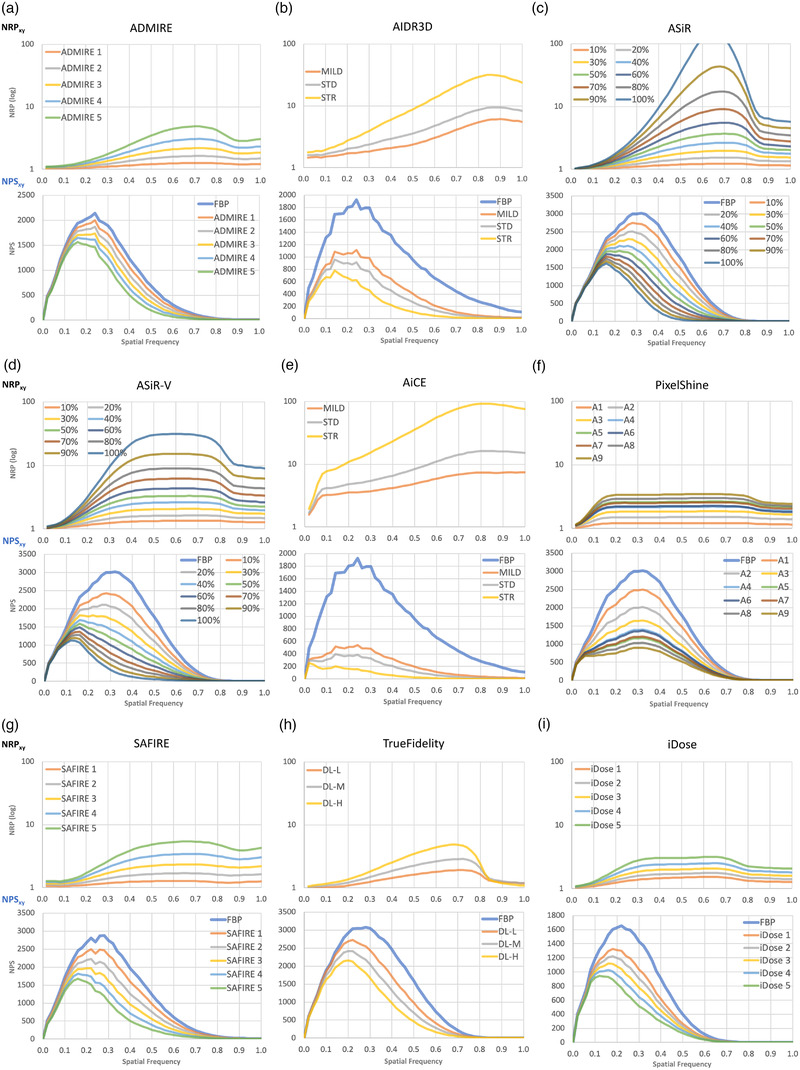
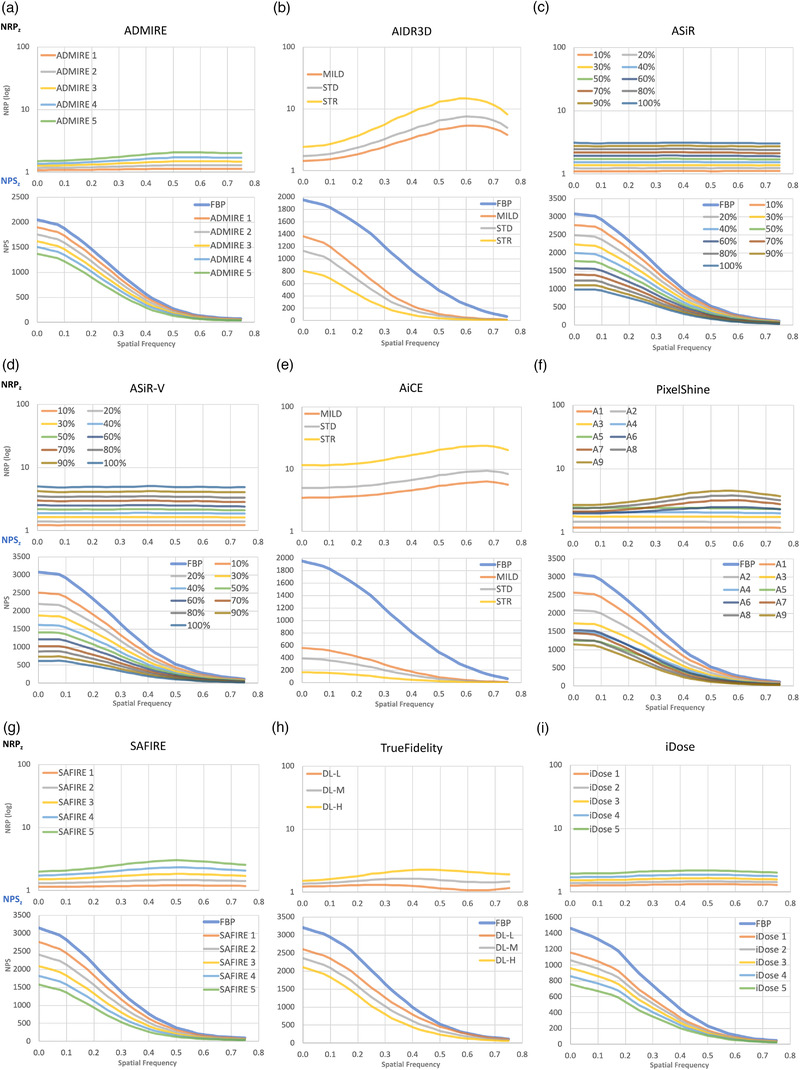
The homogeneous section of the ACR or Catphan phantoms was scanned on different CT scanners equipped with the following NRTs: AIDR3D, AiCE, ASiR, ASiR-V, TrueFidelity, iDose, SAFIRE, and ADMIRE. The images were then reconstructed with all strengths of each NRT in reference to the baseline filtered back projection (FBP) images. One set of the baseline FBP images was also processed with PixelShine, an NRT based on artificial intelligence. The NPSs of the images before and after noise reduction were calculated in both the xy-plane and along the z-direction. The difference in the logarithmic scale between each NPS (baseline FBP and NRT) was then calculated and deemed the NRP. Furthermore, the relationship between the NRP and NPS peak positions was mathematically analyzed.
Each NRT has its own unique NRP. By comparing the NPS and NRP for each NRT, it was found that NRP is related to the peak shift of NPS. Additionally, under the assumption that the NPS has one peak and is differentiable, a relationship was mathematically derived between the slope of the NRP at the peak position of the NPS before noise reduction and the shift of the NPS peak position after noise reduction.
A new metric, NRP, was proposed based on NPS to objectively evaluate and compare methods for noise reduction in CT. The NRP can be used to compare the effects of various NRTs on image noise in both the xy-plane and z-direction. It also enables unbiased assessment of the detailed noise reduction properties of each NRT over all relevant spatial frequencies.
噪声功率谱(NPS)是评估成像系统降噪技术(NRT)性能的常用指标。通过比较有和无 NRT 的图像的 NPS,可以更好地了解 NRT 对图像噪声的影响。然而,在比较 NPS 时,通常使用简单的视觉评估或比较 NPS 峰值或中位数。这些评估使得难以在所有空间频率上客观地评估降噪效果。在这项工作中,我们提出了一种新的降噪谱(NRP),以更全面和客观地评估特定于计算机断层扫描(CT)的各种 NRT 的 NPS。
使用配备以下 NRT 的不同 CT 扫描仪扫描 ACR 或 Catphan 体模的均匀部分:AIDR3D、AiCE、ASiR、ASiR-V、TrueFidelity、iDose、SAFIRE 和 ADMIRE。然后,使用每种 NRT 的所有强度参考基线滤波反投影(FBP)图像重建图像。还使用基于人工智能的 NRT PixelShine 处理一组基线 FBP 图像。在 xy 平面和 z 方向上计算降噪前后图像的 NPS。然后计算每个 NPS(基线 FBP 和 NRT)之间对数尺度的差异,并将其视为 NRP。此外,还对 NRP 和 NPS 峰值位置之间的关系进行了数学分析。
每个 NRT 都有其独特的 NRP。通过比较每个 NRT 的 NPS 和 NRP,发现 NRP 与 NPS 峰值移动有关。此外,假设 NPS 有一个峰值且可微,推导出了 NPS 降噪前峰值位置的 NRP 斜率与降噪后 NPS 峰值位置移动之间的数学关系。
基于 NPS,提出了一种新的指标 NRP,用于客观评估和比较 CT 中的降噪方法。NRP 可用于比较 xy 平面和 z 方向上各种 NRT 对图像噪声的影响。它还可以在所有相关空间频率上对每个 NRT 的详细降噪特性进行无偏评估。