Dutta Abhishek, Dutta Gautam
Department of Environmental Science, Faculty of Science, Chulalongkorn University, 254 Phayathai Road, Pathumwan, Bangkok 10330, Thailand.
Department of Management Studies, Indian Institute of Foreign Trade, 1583, Madurdaha, Kolkata, West Bengal 700100, India.
Heliyon. 2021 Nov;7(11):e08468. doi: 10.1016/j.heliyon.2021.e08468. Epub 2021 Nov 24.
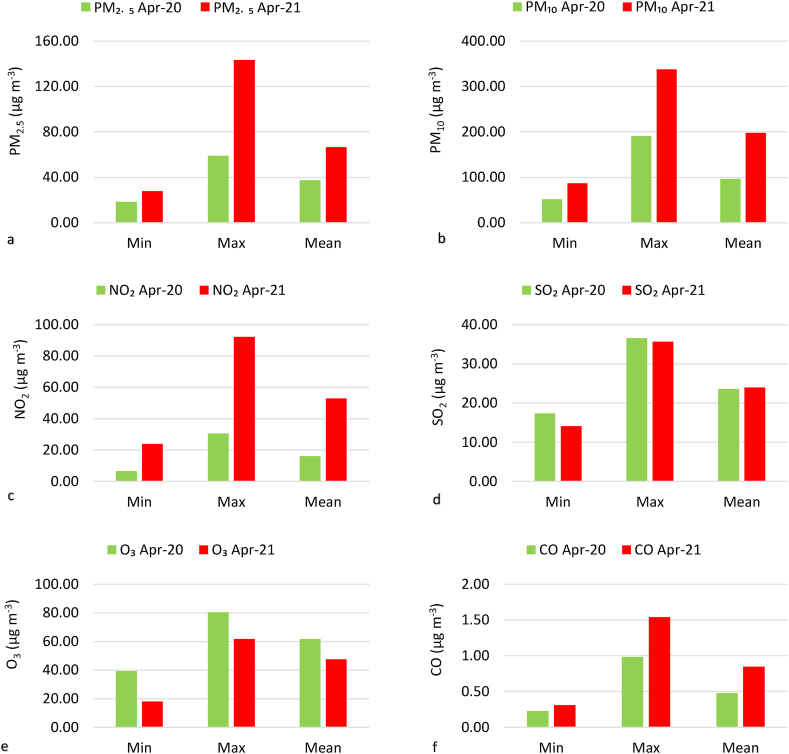
Various countries across the globe have been affected by different COVID-19 waves at different points in time and with varying levels of virulence. With the backdrop of the two COVID-19 waves that broke out in Delhi, this study examines the variations in the concentrations of criteria pollutants, air quality, and meteorological variables across the waves and their influence on COVID-19 morbidity/mortality. Descriptive statistics, violin plots, and Spearman rank correlation tests were employed to assess the variations in environmental parameters and investigate their associations with COVID-19 incidence under the two waves. The susceptible-infected-recovered model and multiple linear regression were used to assess the wave-wise basic reproduction number (R0) and infection spreading trajectory of the virus. Our results show that the first wave in Delhi had three successive peaks and valleys, and the first peak of the second wave was the tallest, indicating the severity of per-day infection cases. During the analysed period (April 2020 and April 2021), concentrations of criteria pollutants varied across the waves, and air pollution was substantially higher during the second wave. In addition, the results revealed that during the second wave, NO maintained a significant negative relationship with COVID-19 (cases per day), while SO had a negative relationship with COVID-19 (cumulative cases) during the first wave. Our results also show a significant positive association of O with COVID-19 deaths during the first wave and cumulative cases and deaths during the second wave. The study indicates that a higher relative humidity in Delhi had a negative relation with COVID-19 cumulative cases and mortality during the first wave. The study confirms that the estimated R0 was marginally different during the two waves, and the spread of COVID-19 new cases followed a cubic growth trajectory. The findings of this study provide valuable information for policymakers in handling COVID-19 waves in various cities.
全球各国在不同时间点受到了不同严重程度的新冠疫情浪潮的影响。以德里爆发的两波新冠疫情为背景,本研究考察了各波疫情期间标准污染物浓度、空气质量和气象变量的变化,以及它们对新冠发病率/死亡率的影响。采用描述性统计、小提琴图和斯皮尔曼等级相关检验来评估环境参数的变化,并研究它们与两波疫情期间新冠发病率的关联。使用易感-感染-康复模型和多元线性回归来评估各波疫情的基本再生数(R0)和病毒的感染传播轨迹。我们的结果表明,德里的第一波疫情有三个连续的高峰和低谷,第二波疫情的第一个高峰最高,表明每日感染病例的严重程度。在分析期(2020年4月至2021年4月)内,各波疫情期间标准污染物浓度有所不同,第二波疫情期间空气污染程度显著更高。此外,结果显示,在第二波疫情期间,NO与新冠(每日病例)保持显著负相关,而在第一波疫情期间,SO与新冠(累计病例)呈负相关。我们的结果还显示,在第一波疫情期间,O与新冠死亡呈显著正相关,在第二波疫情期间与累计病例和死亡呈正相关。研究表明,德里较高的相对湿度在第一波疫情期间与新冠累计病例和死亡率呈负相关。该研究证实,两波疫情期间估计的R0略有不同,新冠新增病例的传播呈三次方增长轨迹。本研究结果为政策制定者应对各城市的新冠疫情浪潮提供了有价值的信息。