Department of Anesthesiology, Osaka City University Graduate School of Medicine, 1-5-7 Asahimachi, Abeno-ku, Osaka, 545-8586, Japan.
BMC Anesthesiol. 2021 Dec 2;21(1):303. doi: 10.1186/s12871-021-01527-y.
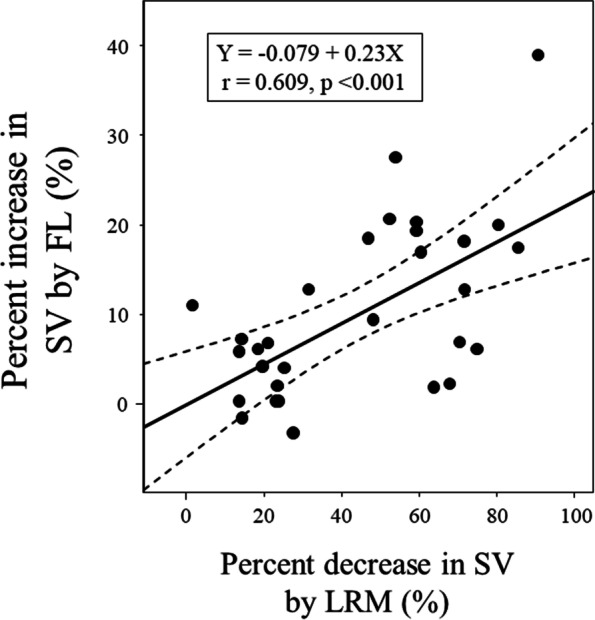
The present study aimed to evaluate the reliability of hemodynamic changes induced by lung recruitment maneuver (LRM) in predicting stroke volume (SV) increase after fluid loading (FL) in prone position.
Thirty patients undergoing spine surgery in prone position were enrolled. Lung-protective ventilation (tidal volume, 6-7 mL/kg; positive end-expiratory pressure, 5 cmHO) was provided to all patients. LRM (30 cmHO for 30 s) was performed. Hemodynamic variables including mean arterial pressure (MAP), heart rate, SV, SV variation (SVV), and pulse pressure variation (PPV) were simultaneously recorded before, during, and at 5 min after LRM and after FL (250 mL in 10 min). Receiver operating characteristic curves were generated to evaluate the predictability of SVV, PPV, and SV decrease by LRM (ΔSV) for SV responders (SV increase after FL > 10%). The gray zone approach was applied for ΔSV.
Areas under the curve (AUCs) for ΔSV, SVV, and PPV to predict SV responders were 0.778 (95% confidence interval: 0.590-0.909), 0.563 (0.371-0.743), and 0.502 (0.315-0.689), respectively. The optimal threshold for ΔSV was 30% (sensitivity, 92.3%; specificity, 70.6%). With the gray zone approach, the inconclusive values ranged 25 to 75% for ΔSV (including 50% of enrolled patients).
In prone position, LRM-induced SV decrease predicted SV increase after FL with higher reliability than traditional dynamic indices. On the other hand, considering the relatively large gray zone in this study, future research is needed to further improve the clinical significance.
UMIN Clinical Trial Registry UMIN000027966 . Registered 28th June 2017.
本研究旨在评估肺复张手法(LRM)引起的血流动力学变化预测俯卧位下液体负荷(FL)后每搏量(SV)增加的可靠性。
纳入 30 例俯卧位行脊柱手术的患者。所有患者均接受肺保护性通气(潮气量 6-7ml/kg;呼气末正压 5cmH2O)。行 LRM(30cmH2O 持续 30s)。在 LRM 前、期间和结束后 5min 以及 FL 后(10min 内输注 250ml)同步记录血流动力学变量,包括平均动脉压(MAP)、心率、SV、SV 变异(SVV)和脉压变异(PPV)。绘制受试者工作特征曲线以评估 LRM 后 SV 下降(ΔSV)、SVV、PPV 预测 SV 反应者(FL 后 SV 增加>10%)的预测能力。采用灰色区域法评估 ΔSV。
ΔSV、SVV 和 PPV 预测 SV 反应者的曲线下面积(AUC)分别为 0.778(95%置信区间:0.590-0.909)、0.563(0.371-0.743)和 0.502(0.315-0.689)。ΔSV 的最佳阈值为 30%(灵敏度 92.3%,特异性 70.6%)。采用灰色区域法,ΔSV 的不确定值范围为 25%至 75%(包括 50%的纳入患者)。
在俯卧位,LRM 引起的 SV 下降预测 FL 后 SV 增加的可靠性高于传统的动态指标。另一方面,考虑到本研究中较大的灰色区域,需要进一步研究以提高其临床意义。
UMIN 临床试验注册 UMIN000027966。注册于 2017 年 6 月 28 日。