• 文献检索
  • 文档翻译
  • 深度研究
  • 学术资讯
  • Suppr Zotero 插件Zotero 插件
  • 邀请有礼
  • 套餐&价格
  • 历史记录
应用&插件
Suppr Zotero 插件Zotero 插件浏览器插件Mac 客户端Windows 客户端微信小程序
定价
高级版会员购买积分包购买API积分包
服务
文献检索文档翻译深度研究API 文档MCP 服务
关于我们
关于 Suppr公司介绍联系我们用户协议隐私条款
关注我们

Suppr 超能文献

核心技术专利:CN118964589B侵权必究
粤ICP备2023148730 号-1Suppr @ 2026

文献检索

告别复杂PubMed语法,用中文像聊天一样搜索,搜遍4000万医学文献。AI智能推荐,让科研检索更轻松。

立即免费搜索

文件翻译

保留排版,准确专业,支持PDF/Word/PPT等文件格式,支持 12+语言互译。

免费翻译文档

深度研究

AI帮你快速写综述,25分钟生成高质量综述,智能提取关键信息,辅助科研写作。

立即免费体验

估算饮食选择对预期寿命的影响:建模研究。

Estimating impact of food choices on life expectancy: A modeling study.

机构信息

Department of Global Public Health and Primary Care, University of Bergen, Norway.

Bergen Addiction Research, Department of Addiction Medicine, Haukeland University Hospital, Bergen, Norway.

出版信息

PLoS Med. 2022 Feb 8;19(2):e1003889. doi: 10.1371/journal.pmed.1003889. eCollection 2022 Feb.

DOI:10.1371/journal.pmed.1003889
PMID:35134067
原文链接:https://pmc.ncbi.nlm.nih.gov/articles/PMC8824353/
Abstract

BACKGROUND

Interpreting and utilizing the findings of nutritional research can be challenging to clinicians, policy makers, and even researchers. To make better decisions about diet, innovative methods that integrate best evidence are needed. We have developed a decision support model that predicts how dietary choices affect life expectancy (LE).

METHODS AND FINDINGS

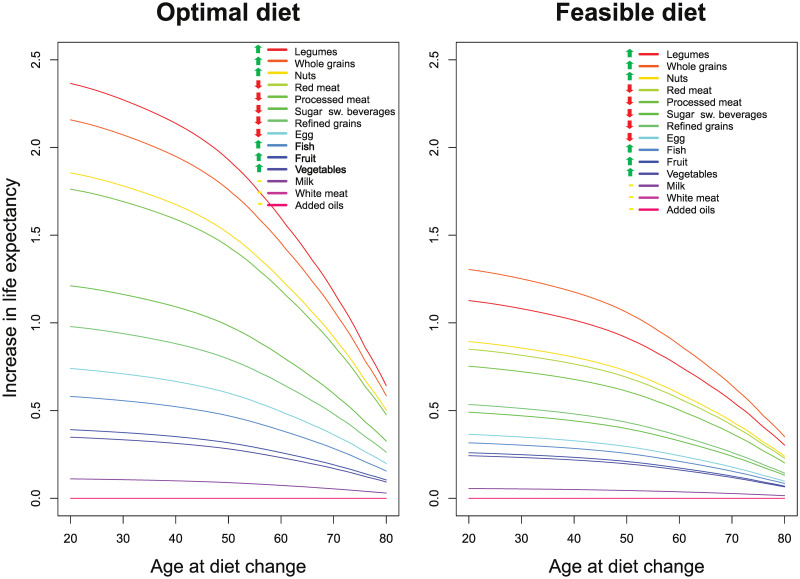
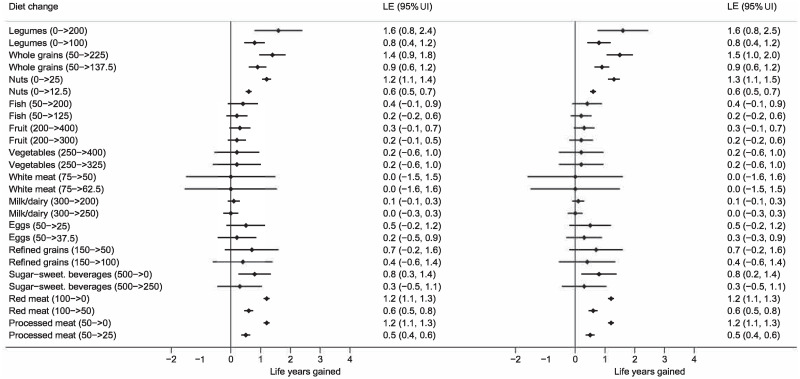
Based on meta-analyses and data from the Global Burden of Disease study (2019), we used life table methodology to estimate how LE changes with sustained changes in the intake of fruits, vegetables, whole grains, refined grains, nuts, legumes, fish, eggs, milk/dairy, red meat, processed meat, and sugar-sweetened beverages. We present estimates (with 95% uncertainty intervals [95% UIs]) for an optimized diet and a feasibility approach diet. An optimal diet had substantially higher intake than a typical diet of whole grains, legumes, fish, fruits, vegetables, and included a handful of nuts, while reducing red and processed meats, sugar-sweetened beverages, and refined grains. A feasibility approach diet was a midpoint between an optimal and a typical Western diet. A sustained change from a typical Western diet to the optimal diet from age 20 years would increase LE by more than a decade for women from the United States (10.7 [95% UI 8.4 to 12.3] years) and men (13.0 [95% UI 9.4 to 14.3] years). The largest gains would be made by eating more legumes (females: 2.2 [95% UI 1.1 to 3.4]; males: 2.5 [95% UI 1.1 to 3.9]), whole grains (females: 2.0 [95% UI 1.3 to 2.7]; males: 2.3 [95% UI 1.6 to 3.0]), and nuts (females: 1.7 [95% UI 1.5 to 2.0]; males: 2.0 [95% UI 1.7 to 2.3]), and less red meat (females: 1.6 [95% UI 1.5 to 1.8]; males: 1.9 [95% UI 1.7 to 2.1]) and processed meat (females: 1.6 [95% UI 1.5 to 1.8]; males: 1.9 [95% UI 1.7 to 2.1]). Changing from a typical diet to the optimized diet at age 60 years would increase LE by 8.0 (95% UI 6.2 to 9.3) years for women and 8.8 (95% UI 6.8 to 10.0) years for men, and 80-year-olds would gain 3.4 years (95% UI females: 2.6 to 3.8/males: 2.7 to 3.9). Change from typical to feasibility approach diet would increase LE by 6.2 (95% UI 3.5 to 8.1) years for 20-year-old women from the United States and 7.3 (95% UI 4.7 to 9.5) years for men. Using NutriGrade, the overall quality of evidence was assessed as moderate. The methodology provides population estimates under given assumptions and is not meant as individualized forecasting, with study limitations that include uncertainty for time to achieve full effects, the effect of eggs, white meat, and oils, individual variation in protective and risk factors, uncertainties for future development of medical treatments; and changes in lifestyle.

CONCLUSIONS

A sustained dietary change may give substantial health gains for people of all ages both for optimized and feasible changes. Gains are predicted to be larger the earlier the dietary changes are initiated in life. The Food4HealthyLife calculator that we provide online could be useful for clinicians, policy makers, and laypeople to understand the health impact of dietary choices.

https://cdn.ncbi.nlm.nih.gov/pmc/blobs/4ec1/8824353/aed5cb4ed176/pmed.1003889.g003.jpg
https://cdn.ncbi.nlm.nih.gov/pmc/blobs/4ec1/8824353/cff7b3a76189/pmed.1003889.g001.jpg
https://cdn.ncbi.nlm.nih.gov/pmc/blobs/4ec1/8824353/9399ed8c4ab4/pmed.1003889.g002.jpg
https://cdn.ncbi.nlm.nih.gov/pmc/blobs/4ec1/8824353/aed5cb4ed176/pmed.1003889.g003.jpg
https://cdn.ncbi.nlm.nih.gov/pmc/blobs/4ec1/8824353/cff7b3a76189/pmed.1003889.g001.jpg
https://cdn.ncbi.nlm.nih.gov/pmc/blobs/4ec1/8824353/9399ed8c4ab4/pmed.1003889.g002.jpg
https://cdn.ncbi.nlm.nih.gov/pmc/blobs/4ec1/8824353/aed5cb4ed176/pmed.1003889.g003.jpg
摘要

背景

对于临床医生、政策制定者甚至研究人员来说,解释和利用营养研究结果可能具有挑战性。为了更好地做出有关饮食的决策,需要创新的方法来整合最佳证据。我们已经开发出一种决策支持模型,该模型可以预测饮食选择如何影响预期寿命 (LE)。

方法和发现

基于荟萃分析和全球疾病负担研究的数据(2019 年),我们使用生命表方法来估计随着水果、蔬菜、全谷物、精制谷物、坚果、豆类、鱼类、鸡蛋、牛奶/乳制品、红肉、加工肉和含糖饮料的摄入量持续变化,LE 如何变化。我们提供了优化饮食和可行性方法饮食的估计值(带有 95%置信区间 [95%UI])。优化饮食的摄入量大大高于全谷物、豆类、鱼类、水果、蔬菜的典型饮食,同时减少了红肉和加工肉类、含糖饮料和精制谷物的摄入量。可行性方法饮食是优化和典型西方饮食之间的中点。从 20 岁开始,从典型的西方饮食转变为最佳饮食,将使美国女性的 LE 增加 10 年以上(女性 10.7 [95%UI 8.4 至 12.3] 年),男性增加 13 年(男性 9.4 至 14.3 年)。最大的收益将通过食用更多的豆类(女性:2.2 [95%UI 1.1 至 3.4];男性:2.5 [95%UI 1.1 至 3.9])、全谷物(女性:2.0 [95%UI 1.3 至 2.7];男性:2.3 [95%UI 1.6 至 3.0])和坚果(女性:1.7 [95%UI 1.5 至 2.0];男性:2.0 [95%UI 1.7 至 2.3]),以及减少红肉(女性:1.6 [95%UI 1.5 至 1.8];男性:1.9 [95%UI 1.7 至 2.1])和加工肉(女性:1.6 [95%UI 1.5 至 1.8];男性:1.9 [95%UI 1.7 至 2.1])来实现。从典型饮食转变为 60 岁时的优化饮食,将使美国女性的 LE 增加 8.0 年(95%UI 6.2 至 9.3 年),男性增加 8.8 年(95%UI 6.8 至 10.0 年),80 岁的人将获得 3.4 年(95%UI 女性:2.6 至 3.8/男性:2.7 至 3.9)。从典型饮食转变为可行性方法饮食将使美国 20 岁女性的 LE 增加 6.2 年(95%UI 3.5 至 8.1 年),男性增加 7.3 年(95%UI 4.7 至 9.5 年)。使用 NutriGrade 评估了证据的总体质量,认为是中等水平。该方法根据给定的假设提供人口估计,不作为个体化预测,研究存在的局限性包括达到完全效果的时间不确定、鸡蛋、白色肉类和油脂的效果、保护和危险因素的个体差异、医疗治疗未来发展的不确定性;以及生活方式的变化。

结论

对于各个年龄段的人来说,持续的饮食变化可能会带来可观的健康收益,无论是优化饮食还是可行的饮食变化。预计早期开始饮食变化,收益会更大。我们在线提供的 Food4HealthyLife 计算器可以帮助临床医生、政策制定者和普通大众了解饮食选择对健康的影响。

相似文献

1
Estimating impact of food choices on life expectancy: A modeling study.估算饮食选择对预期寿命的影响:建模研究。
PLoS Med. 2022 Feb 8;19(2):e1003889. doi: 10.1371/journal.pmed.1003889. eCollection 2022 Feb.
2
Life expectancy gains from dietary modifications: a comparative modeling study in 7 countries.饮食调整带来的预期寿命增长:7 个国家的比较建模研究。
Am J Clin Nutr. 2024 Jul;120(1):170-177. doi: 10.1016/j.ajcnut.2024.04.028. Epub 2024 Apr 29.
3
Association Between Dietary Factors and Mortality From Heart Disease, Stroke, and Type 2 Diabetes in the United States.美国饮食因素与心脏病、中风及2型糖尿病死亡率之间的关联
JAMA. 2017 Mar 7;317(9):912-924. doi: 10.1001/jama.2017.0947.
4
Food groups and risk of coronary heart disease, stroke and heart failure: A systematic review and dose-response meta-analysis of prospective studies.食物组与冠心病、中风和心力衰竭的风险:前瞻性研究的系统评价和剂量反应荟萃分析。
Crit Rev Food Sci Nutr. 2019;59(7):1071-1090. doi: 10.1080/10408398.2017.1392288. Epub 2017 Nov 7.
5
Food groups and risk of type 2 diabetes mellitus: a systematic review and meta-analysis of prospective studies.食物类别与2型糖尿病风险:前瞻性研究的系统评价和荟萃分析
Eur J Epidemiol. 2017 May;32(5):363-375. doi: 10.1007/s10654-017-0246-y. Epub 2017 Apr 10.
6
Food Groups and Risk of Hypertension: A Systematic Review and Dose-Response Meta-Analysis of Prospective Studies.食物类别与高血压风险:前瞻性研究的系统评价和剂量反应荟萃分析
Adv Nutr. 2017 Nov 15;8(6):793-803. doi: 10.3945/an.117.017178. Print 2017 Nov.
7
The potential impact of food taxes and subsidies on cardiovascular disease and diabetes burden and disparities in the United States.食品税和补贴对美国心血管疾病、糖尿病负担及差异的潜在影响。
BMC Med. 2017 Nov 27;15(1):208. doi: 10.1186/s12916-017-0971-9.
8
9
Red and Processed Meats and Health Risks: How Strong Is the Evidence?红肉类和加工肉类与健康风险:证据有多大力度?
Diabetes Care. 2020 Feb;43(2):265-271. doi: 10.2337/dci19-0063.
10
The economic burden of not meeting food recommendations in Canada: The cost of doing nothing.加拿大未能满足食品建议的经济负担:不作为的代价。
PLoS One. 2018 Apr 27;13(4):e0196333. doi: 10.1371/journal.pone.0196333. eCollection 2018.

引用本文的文献

1
Realistic expectations for changes to average human lifespan in the near future.对近期人类平均寿命变化的现实期望。
Biogerontology. 2025 Aug 29;26(5):176. doi: 10.1007/s10522-025-10318-8.
2
Associations among skin carotenoids, anthropometric parameters and healthy lifestyle behaviors in young adults: a cross-sectional, population-based study.年轻成年人皮肤类胡萝卜素、人体测量参数与健康生活方式行为之间的关联:一项基于人群的横断面研究。
J Transl Med. 2025 Aug 22;23(1):952. doi: 10.1186/s12967-025-06978-2.
3
Toward precision interventions and metrics of inflammaging.

本文引用的文献

1
Estimating Health Adjusted Age at Death (HAAD).估算健康调整死亡年龄(HAAD)。
PLoS One. 2020 Jul 14;15(7):e0235955. doi: 10.1371/journal.pone.0235955. eCollection 2020.
2
Red and Processed Meat Consumption and Risk for All-Cause Mortality and Cardiometabolic Outcomes: A Systematic Review and Meta-analysis of Cohort Studies.食用红色和加工肉类与全因死亡率和心血管代谢结局的关系:队列研究的系统评价和荟萃分析。
Ann Intern Med. 2019 Nov 19;171(10):703-710. doi: 10.7326/M19-0655. Epub 2019 Oct 1.
3
Milk and Dairy Product Consumption and Risk of Mortality: An Overview of Systematic Reviews and Meta-Analyses.
迈向精准干预与炎症衰老指标
Nat Aging. 2025 Aug;5(8):1441-1454. doi: 10.1038/s43587-025-00938-7. Epub 2025 Aug 14.
4
Combined Phytochemical Sulforaphane and Dietary Fiber Inulin Contribute to the Prevention of ER-Negative Breast Cancer via PI3K/AKT/MTOR Pathway and Modulating Gut Microbial Composition.联合植物化学物质萝卜硫素和膳食纤维菊粉通过PI3K/AKT/MTOR途径及调节肠道微生物组成有助于预防雌激素受体阴性乳腺癌。
Nutrients. 2025 Jun 17;17(12):2023. doi: 10.3390/nu17122023.
5
Promoting Healthy Longevity Should Start Young: A Life Course Journey.促进健康长寿应从年轻时开始:一生的旅程。
Matern Fetal Med. 2024 Jan;6(1):1-4. doi: 10.1097/FM9.0000000000000212. Epub 2024 Jan 26.
6
Dietary associations with reduced epigenetic age: a secondary data analysis of the methylation diet and lifestyle study.与表观遗传年龄降低相关的饮食因素:甲基化饮食与生活方式研究的二次数据分析
Aging (Albany NY). 2025 Apr 17;17(4):994-1010. doi: 10.18632/aging.206240.
7
Non-communicable disease burden through adhering to Dutch dietary guidelines: a modeling study to estimate future reductions.遵循荷兰饮食指南对非传染性疾病负担的影响:一项预测未来负担减轻情况的建模研究
EClinicalMedicine. 2025 Mar 27;82:103170. doi: 10.1016/j.eclinm.2025.103170. eCollection 2025 Apr.
8
Biomarkers of aging: from molecules and surrogates to physiology and function.衰老的生物标志物:从分子与替代指标到生理学与功能
Physiol Rev. 2025 Jul 1;105(3):1609-1694. doi: 10.1152/physrev.00045.2024. Epub 2025 Mar 20.
9
Umbrella Review of Systematic Reviews and Meta-Analyses on the Consumption of Different Food Groups and the Risk of Overweight and Obesity.关于不同食物组的消费与超重和肥胖风险的系统评价和荟萃分析的伞状综述
Nutrients. 2025 Feb 13;17(4):662. doi: 10.3390/nu17040662.
10
Umbrella Review of Systematic Reviews and Meta-analyses on Consumption of Different Food Groups and Risk of All-cause Mortality.关于不同食物组的消费与全因死亡率风险的系统评价和荟萃分析的伞状综述
Adv Nutr. 2025 Apr;16(4):100393. doi: 10.1016/j.advnut.2025.100393. Epub 2025 Feb 15.
牛奶和乳制品消费与死亡率风险:系统评价和荟萃分析概述。
Adv Nutr. 2019 May 1;10(suppl_2):S97-S104. doi: 10.1093/advances/nmy128.
4
Health effects of dietary risks in 195 countries, 1990-2017: a systematic analysis for the Global Burden of Disease Study 2017.195 个国家 1990 年至 2017 年饮食风险对健康的影响:2017 年全球疾病负担研究的系统分析。
Lancet. 2019 May 11;393(10184):1958-1972. doi: 10.1016/S0140-6736(19)30041-8. Epub 2019 Apr 4.
5
Food Groups and Risk of Overweight, Obesity, and Weight Gain: A Systematic Review and Dose-Response Meta-Analysis of Prospective Studies.食物组与超重、肥胖和体重增加的风险:前瞻性研究的系统评价和剂量反应荟萃分析。
Adv Nutr. 2019 Mar 1;10(2):205-218. doi: 10.1093/advances/nmy092.
6
Food in the Anthropocene: the EAT-Lancet Commission on healthy diets from sustainable food systems.人类世的食物:EAT-柳叶刀可持续食物系统健康饮食委员会
Lancet. 2019 Feb 2;393(10170):447-492. doi: 10.1016/S0140-6736(18)31788-4. Epub 2019 Jan 16.
7
The Associations of Fruit and Vegetable Intakes with Burden of Diseases: A Systematic Review of Meta-Analyses.水果和蔬菜摄入量与疾病负担的关联:系统评价的荟萃分析。
J Acad Nutr Diet. 2019 Mar;119(3):464-481. doi: 10.1016/j.jand.2018.11.007. Epub 2019 Jan 11.
8
Food groups and intermediate disease markers: a systematic review and network meta-analysis of randomized trials.食物组与中间疾病标志物:随机试验的系统评价与网络荟萃分析。
Am J Clin Nutr. 2018 Sep 1;108(3):576-586. doi: 10.1093/ajcn/nqy151.
9
Global, regional, and national age-sex-specific mortality for 282 causes of death in 195 countries and territories, 1980-2017: a systematic analysis for the Global Burden of Disease Study 2017.全球、区域和国家按年龄、性别和死因分类的死亡率,195 个国家和地区,1980-2017 年:2017 年全球疾病负担研究的系统分析。
Lancet. 2018 Nov 10;392(10159):1736-1788. doi: 10.1016/S0140-6736(18)32203-7. Epub 2018 Nov 8.
10
Forecasting life expectancy, years of life lost, and all-cause and cause-specific mortality for 250 causes of death: reference and alternative scenarios for 2016-40 for 195 countries and territories.预测 250 种死因的预期寿命、损失的生命年数以及全因和特定死因死亡率:2016-2040 年 195 个国家和地区的参考和替代情景。
Lancet. 2018 Nov 10;392(10159):2052-2090. doi: 10.1016/S0140-6736(18)31694-5. Epub 2018 Oct 16.