Division of Chemistry and Chemical Engineering, California Institute of Technology, Pasadena, California 91125, United States.
Division of Biology and Biological Engineering, California Institute of Technology, Pasadena, California 91125, United States.
Environ Sci Technol. 2022 Jul 5;56(13):9623-9631. doi: 10.1021/acs.est.2c00927. Epub 2022 Jun 14.
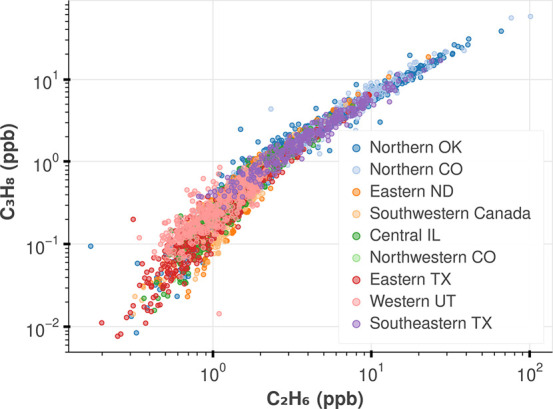
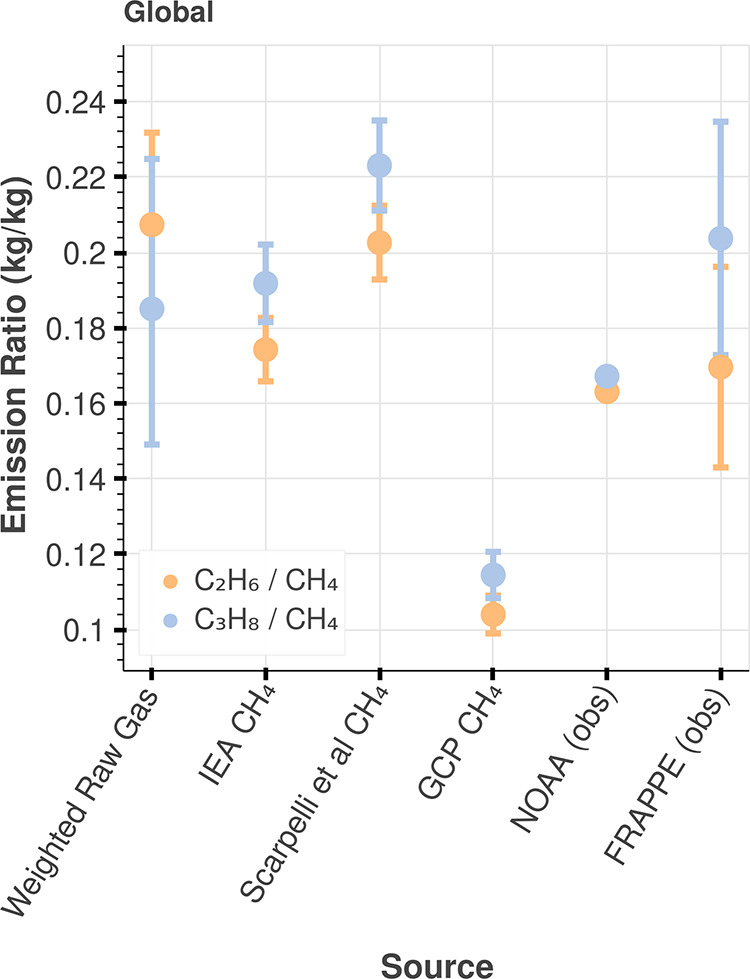
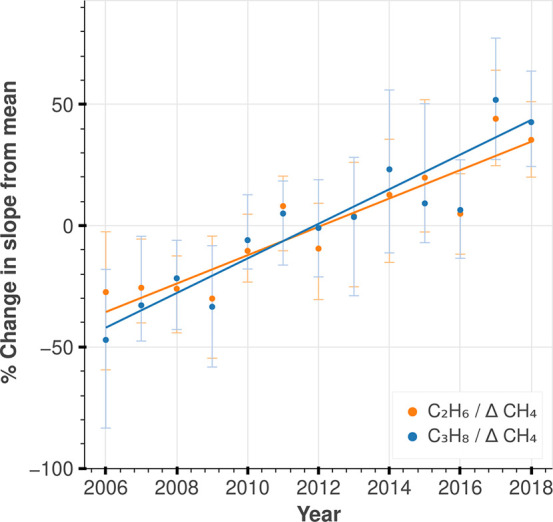
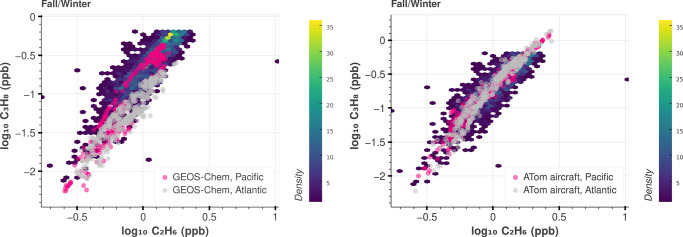
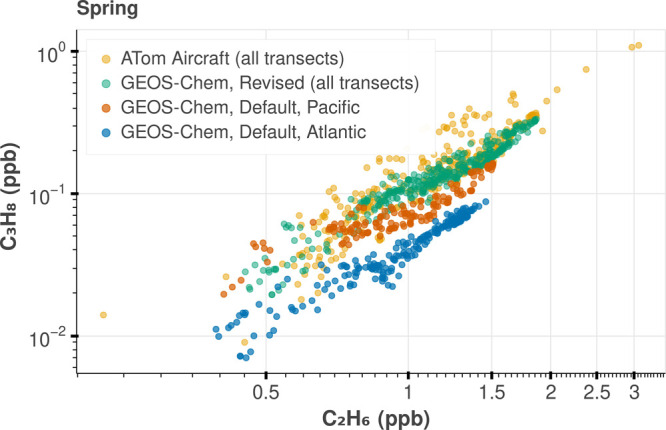
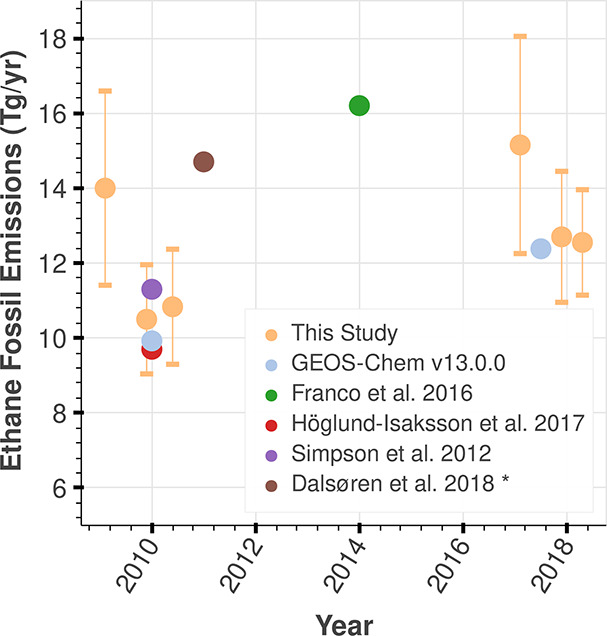
We use global airborne observations of propane (CH) and ethane (CH) from the Atmospheric Tomography (ATom) and HIAPER Pole-to-Pole Observations (HIPPO), as well as U.S.-based aircraft and tower observations by NOAA and from the NCAR FRAPPE campaign as tracers for emissions from oil and gas operations. To simulate global mole fraction fields for these gases, we update the default emissions' configuration of CH used by the global chemical transport model, GEOS-Chem v13.0.0, using a scaled CH spatial proxy. With the updated emissions, simulations of both CH and CH using GEOS-Chem are in reasonable agreement with ATom and HIPPO observations, though the updated emission fields underestimate CH accumulation in the arctic wintertime, pointing to additional sources of this gas in the high latitudes (e.g., Europe). Using a Bayesian hierarchical model, we estimate global emissions of CH and CH from fossil fuel production in 2016-2018 to be 13.3 ± 0.7 (95% CI) and 14.7 ± 0.8 (95% CI) Tg/year, respectively. We calculate bottom-up hydrocarbon emission ratios using basin composition measurements weighted by gas production and find their magnitude is higher than expected and is similar to ratios informed by our revised alkane emissions. This suggests that emissions are dominated by pre-processing activities in oil-producing basins.
我们利用大气层析观测计划(ATom)和高分辨率极地观测计划(HIPPO)获取的全球丙烷(CH)和乙烷(CH)的空气传播观测数据,以及美国国家海洋和大气管理局(NOAA)的飞机和观测塔数据和 NCAR FRAPPE 考察活动的数据,将这些数据作为油气作业排放的示踪剂。为了模拟这些气体的全球分子分数场,我们使用经过缩放的 CH 空间代理来更新全球化学输送模型 GEOS-Chem v13.0.0 中 CH 的默认排放配置。使用更新后的排放数据,GEOS-Chem 对 CH 和 CH 的模拟与 ATom 和 HIPPO 的观测结果较为吻合,尽管更新后的排放场低估了北极冬季 CH 的积累量,这表明在高纬度地区(例如欧洲)存在这种气体的其他来源。我们利用贝叶斯分层模型,估计 2016-2018 年化石燃料生产过程中 CH 和 CH 的全球排放量分别为 13.3 ± 0.7(95%置信区间)和 14.7 ± 0.8(95%置信区间)Tg/年。我们使用按天然气产量加权的盆地组成测量值计算了自下而上的碳氢化合物排放比,发现其数值高于预期,与我们修正后的烷烃排放比相似。这表明排放主要来自产油盆地的预处理活动。