Department of Global Health and Development, London School of Hygiene and Tropical Medicine, 15-17, Tavistock Place, London WC1H 9SH, UK.
Information Systems Department, College of Computing and Information Sciences, Makerere University, PO Box 7062, Kampala, Uganda.
Health Policy Plan. 2022 Nov 14;37(10):1328-1336. doi: 10.1093/heapol/czac064.
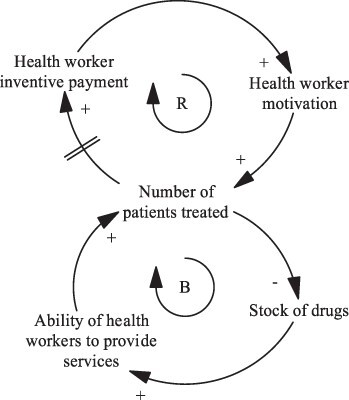
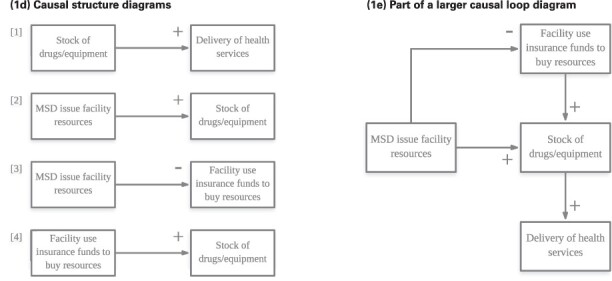
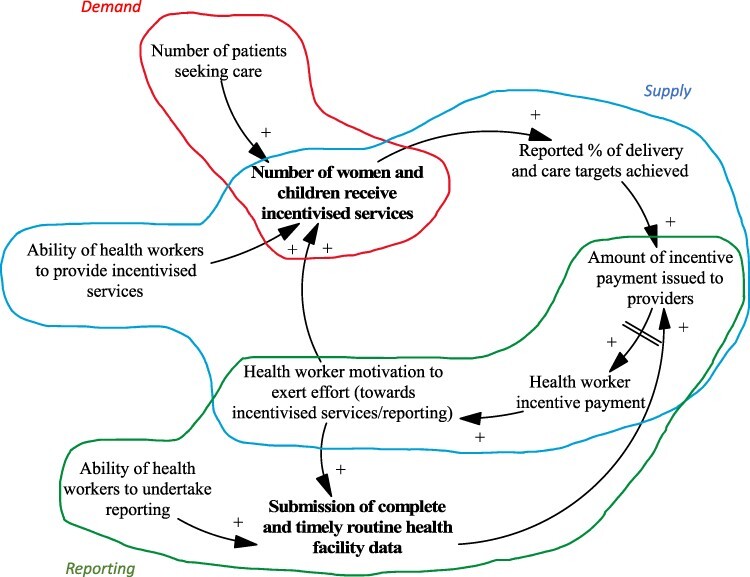
Causal loop diagrams (CLDs) are a systems thinking method that can be used to visualize and unpack complex health system behaviour. They can be employed prospectively or retrospectively to identify the mechanisms and consequences of policies or interventions designed to strengthen health systems and inform discussion with policymakers and stakeholders on actions that may alleviate sub-optimal outcomes. Whilst the use of CLDs in health systems research has generally increased, there is still limited use in low- and middle-income settings. In addition to their suitability for evaluating complex systems, CLDs can be developed where opportunities for primary data collection may be limited (such as in humanitarian or conflict settings) and instead be formulated using secondary data, published or grey literature, health surveys/reports and policy documents. The purpose of this paper is to provide a step-by-step guide for designing a health system research study that uses CLDs as their chosen research method, with particular attention to issues of relevance to research in low- and middle-income countries (LMICs). The guidance draws on examples from the LMIC literature and authors' own experience of using CLDs in this research area. This paper guides researchers in addressing the following four questions in the study design process; (1) What is the scope of this research? (2) What data do I need to collect or source? (3) What is my chosen method for CLD development? (4) How will I validate the CLD? In providing supporting information to readers on avenues for addressing these key design questions, authors hope to promote CLDs for wider use by health system researchers working in LMICs.
因果关系图(CLD)是一种系统思维方法,可用于可视化和剖析复杂的卫生系统行为。它可以前瞻性或回顾性地用于识别旨在加强卫生系统的政策或干预措施的机制和后果,并为决策者和利益相关者提供讨论,以采取可能缓解次优结果的行动。尽管 CLD 在卫生系统研究中的使用总体上有所增加,但在中低收入国家的使用仍然有限。除了适合评估复杂系统外,CLD 还可以在可能限制原始数据收集机会的情况下(例如在人道主义或冲突环境中)制定,而是可以使用二手数据、已发表或灰色文献、卫生调查/报告和政策文件来制定。本文的目的是提供一个使用 CLD 作为首选研究方法的卫生系统研究设计的分步指南,特别关注与中低收入国家(LMIC)研究相关的问题。该指南借鉴了来自 LMIC 文献的示例和作者在该研究领域使用 CLD 的经验。本文指导研究人员在研究设计过程中回答以下四个问题;(1)本研究的范围是什么?(2)我需要收集或来源什么数据?(3)我选择的 CLD 开发方法是什么?(4)我将如何验证 CLD?通过为读者提供解决这些关键设计问题的途径的支持信息,作者希望促进 CLD 在中低收入国家从事卫生系统研究的研究人员中更广泛地使用。