• 文献检索
  • 文档翻译
  • 深度研究
  • 学术资讯
  • Suppr Zotero 插件Zotero 插件
  • 邀请有礼
  • 套餐&价格
  • 历史记录
应用&插件
Suppr Zotero 插件Zotero 插件浏览器插件Mac 客户端Windows 客户端微信小程序
定价
高级版会员购买积分包购买API积分包
服务
文献检索文档翻译深度研究API 文档MCP 服务
关于我们
关于 Suppr公司介绍联系我们用户协议隐私条款
关注我们

Suppr 超能文献

核心技术专利:CN118964589B侵权必究
粤ICP备2023148730 号-1Suppr @ 2026

文献检索

告别复杂PubMed语法,用中文像聊天一样搜索,搜遍4000万医学文献。AI智能推荐,让科研检索更轻松。

立即免费搜索

文件翻译

保留排版,准确专业,支持PDF/Word/PPT等文件格式,支持 12+语言互译。

免费翻译文档

深度研究

AI帮你快速写综述,25分钟生成高质量综述,智能提取关键信息,辅助科研写作。

立即免费体验

碳监测城市 全球 1500 个城市的 CO2 排放近实时日估算。

Carbon Monitor Cities near-real-time daily estimates of CO emissions from 1500 cities worldwide.

机构信息

Department of Earth System Science, Tsinghua University, Beijing, 100084, China.

Laboratoire des Sciences du Climate et de l'Environnement LSCE, Orme de Merisiers 91191, Gif-sur-Yvette, France.

出版信息

Sci Data. 2022 Sep 1;9(1):533. doi: 10.1038/s41597-022-01657-z.

DOI:10.1038/s41597-022-01657-z
PMID:36050332
原文链接:https://pmc.ncbi.nlm.nih.gov/articles/PMC9434530/
Abstract

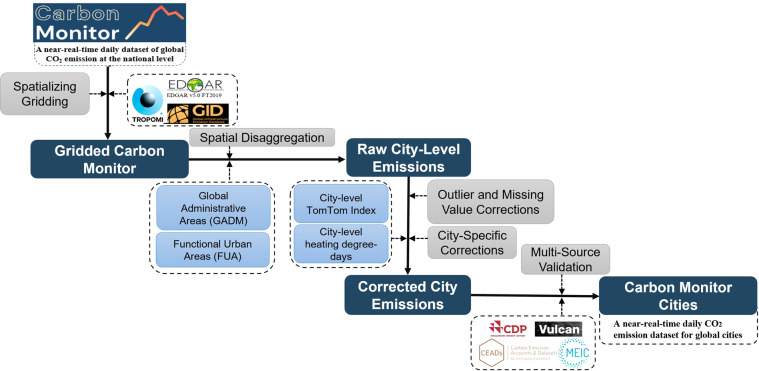
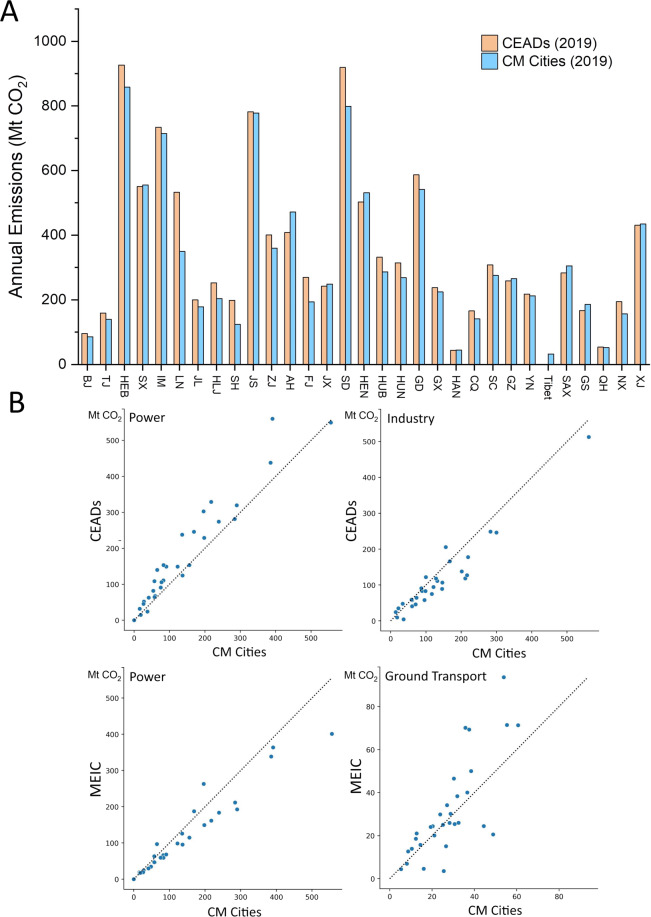
Building on near-real-time and spatially explicit estimates of daily carbon dioxide (CO) emissions, here we present and analyze a new city-level dataset of fossil fuel and cement emissions, Carbon Monitor Cities, which provides daily estimates of emissions from January 2019 through December 2021 for 1500 cities in 46 countries, and disaggregates five sectors: power generation, residential (buildings), industry, ground transportation, and aviation. The goal of this dataset is to improve the timeliness and temporal resolution of city-level emission inventories and includes estimates for both functional urban areas and city administrative areas that are consistent with global and regional totals. Comparisons with other datasets (i.e. CEADs, MEIC, Vulcan, and CDP-ICLEI Track) were performed, and we estimate the overall annual uncertainty range to be ±21.7%. Carbon Monitor Cities is a near-real-time, city-level emission dataset that includes cities around the world, including the first estimates for many cities in low-income countries.

摘要

基于对每日二氧化碳(CO)排放的近乎实时和空间明确的估算,我们在此提出并分析了一个新的城市层面化石燃料和水泥排放数据集——Carbon Monitor Cities,该数据集提供了 46 个国家的 1500 个城市从 2019 年 1 月至 2021 年 12 月的每日排放量估算,并对五个部门进行了细分:发电、住宅(建筑物)、工业、地面交通和航空。该数据集的目标是提高城市层面排放清单的及时性和时间分辨率,并包括与全球和区域总量一致的功能城市区域和城市行政区域的估算。我们还与其他数据集(即 CEADs、MEIC、Vulcan 和 CDP-ICLEI Track)进行了比较,并估计总体年度不确定性范围为±21.7%。Carbon Monitor Cities 是一个近乎实时的城市层面排放数据集,其中包括世界各地的城市,包括许多低收入国家的首批城市估算数据。

https://cdn.ncbi.nlm.nih.gov/pmc/blobs/60d5/9437075/deb9601f3d52/41597_2022_1657_Fig10_HTML.jpg
https://cdn.ncbi.nlm.nih.gov/pmc/blobs/60d5/9437075/16c5e368d87f/41597_2022_1657_Fig1_HTML.jpg
https://cdn.ncbi.nlm.nih.gov/pmc/blobs/60d5/9437075/391ea9219517/41597_2022_1657_Fig2_HTML.jpg
https://cdn.ncbi.nlm.nih.gov/pmc/blobs/60d5/9437075/75e5d76d8c78/41597_2022_1657_Fig3_HTML.jpg
https://cdn.ncbi.nlm.nih.gov/pmc/blobs/60d5/9437075/34973a6ae4db/41597_2022_1657_Fig4_HTML.jpg
https://cdn.ncbi.nlm.nih.gov/pmc/blobs/60d5/9437075/6b7bff31fb6a/41597_2022_1657_Fig5_HTML.jpg
https://cdn.ncbi.nlm.nih.gov/pmc/blobs/60d5/9437075/e0783e88aa15/41597_2022_1657_Fig6_HTML.jpg
https://cdn.ncbi.nlm.nih.gov/pmc/blobs/60d5/9437075/afe348a0245d/41597_2022_1657_Fig7_HTML.jpg
https://cdn.ncbi.nlm.nih.gov/pmc/blobs/60d5/9437075/15e34921ee24/41597_2022_1657_Fig8_HTML.jpg
https://cdn.ncbi.nlm.nih.gov/pmc/blobs/60d5/9437075/53901c7acf9b/41597_2022_1657_Fig9_HTML.jpg
https://cdn.ncbi.nlm.nih.gov/pmc/blobs/60d5/9437075/deb9601f3d52/41597_2022_1657_Fig10_HTML.jpg

相似文献

1
Carbon Monitor Cities near-real-time daily estimates of CO emissions from 1500 cities worldwide.碳监测城市 全球 1500 个城市的 CO2 排放近实时日估算。
Sci Data. 2022 Sep 1;9(1):533. doi: 10.1038/s41597-022-01657-z.
2
Near-real-time daily estimates of fossil fuel CO emissions from major high-emission cities in China.中国主要高排放城市化石燃料 CO 排放的近实时日估算。
Sci Data. 2022 Nov 10;9(1):684. doi: 10.1038/s41597-022-01796-3.
3
Carbon Monitor, a near-real-time daily dataset of global CO emission from fossil fuel and cement production.碳监测仪,一个近乎实时的全球化石燃料和水泥生产二氧化碳排放逐日数据集。
Sci Data. 2020 Nov 9;7(1):392. doi: 10.1038/s41597-020-00708-7.
4
Carbon Monitor Europe near-real-time daily CO emissions for 27 EU countries and the United Kingdom.欧洲碳监测近实时日 CO 排放数据,覆盖 27 个欧盟国家和英国。
Sci Data. 2023 Jun 8;10(1):374. doi: 10.1038/s41597-023-02284-y.
5
Near-real-time global gridded daily CO emissions.近实时全球网格化每日一氧化碳排放量。
Innovation (Camb). 2021 Nov 2;3(1):100182. doi: 10.1016/j.xinn.2021.100182. eCollection 2022 Jan 25.
6
Comparing a global high-resolution downscaled fossil fuel CO emission dataset to local inventory-based estimates over 14 global cities.将一个全球高分辨率降尺度化石燃料二氧化碳排放数据集与基于本地清单估算的14个全球城市的排放数据进行比较。
Carbon Balance Manag. 2020 May 19;15(1):9. doi: 10.1186/s13021-020-00146-3.
7
Near-real-time global gridded daily CO2 emissions 2021.2021 年全球网格化逐日近实时二氧化碳排放量。
Sci Data. 2023 Feb 2;10(1):69. doi: 10.1038/s41597-023-01963-0.
8
A city-level comparison of fossil-fuel and industry processes-induced CO emissions over the Beijing-Tianjin-Hebei region from eight emission inventories.基于八个排放清单对京津冀地区化石燃料和工业过程导致的一氧化碳排放进行的城市层面比较。
Carbon Balance Manag. 2020 Dec 3;15(1):25. doi: 10.1186/s13021-020-00163-2.
9
The impact of human and livestock respiration on CO emissions from 14 global cities.人类和牲畜呼吸对全球14个城市一氧化碳排放的影响。
Carbon Balance Manag. 2022 Nov 3;17(1):17. doi: 10.1186/s13021-022-00217-7.
10
Analysis and Prediction of Influence Factors of Green Computing on Carbon Cycle Process in Smart City.智慧城市中绿色计算对碳循环过程影响因素的分析与预测。
Comput Intell Neurosci. 2022 Aug 8;2022:7546742. doi: 10.1155/2022/7546742. eCollection 2022.

引用本文的文献

1
China's county-level monthly CO emissions during 2013-2021.2013年至2021年期间中国县级月度一氧化碳排放量。
Sci Data. 2025 Jul 14;12(1):1217. doi: 10.1038/s41597-025-05461-3.
2
COP29: Progresses and challenges to global efforts on the climate crisis.《联合国气候变化框架公约》第二十九次缔约方大会:全球应对气候危机努力的进展与挑战
Innovation (Camb). 2024 Dec 3;6(1):100748. doi: 10.1016/j.xinn.2024.100748. eCollection 2025 Jan 6.
3
Spatiotemporal atmospheric in-situ carbon dioxide data over the Indian sites-data perspective.印度站点上空二氧化碳的时空原位大气数据——数据视角。

本文引用的文献

1
Monitoring global carbon emissions in 2021.2021年全球碳排放监测。
Nat Rev Earth Environ. 2022;3(4):217-219. doi: 10.1038/s43017-022-00285-w. Epub 2022 Mar 21.
2
Near-real-time global gridded daily CO emissions.近实时全球网格化每日一氧化碳排放量。
Innovation (Camb). 2021 Nov 2;3(1):100182. doi: 10.1016/j.xinn.2021.100182. eCollection 2022 Jan 25.
3
Monthly direct and indirect greenhouse gases emissions from household consumption in the major Japanese cities.日本主要城市家庭消费的月度直接和间接温室气体排放量。
Sci Data. 2024 Apr 16;11(1):385. doi: 10.1038/s41597-024-03243-x.
4
Time and frequency analysis of daily-based nexus between global CO emissions and electricity generation nexus by novel WLMC approach.采用新型加权局部平均交叉相关(WLMC)方法对全球一氧化碳(CO)排放与发电之间基于日数据的联系进行时间和频率分析。
Sci Rep. 2024 Feb 14;14(1):3698. doi: 10.1038/s41598-024-54245-z.
5
Unequal urban heat burdens impede climate justice and equity goals.城市热负担不均阻碍了气候正义和公平目标。
Innovation (Camb). 2023 Jul 28;4(5):100488. doi: 10.1016/j.xinn.2023.100488. eCollection 2023 Sep 11.
6
Carbon Monitor Europe near-real-time daily CO emissions for 27 EU countries and the United Kingdom.欧洲碳监测近实时日 CO 排放数据,覆盖 27 个欧盟国家和英国。
Sci Data. 2023 Jun 8;10(1):374. doi: 10.1038/s41597-023-02284-y.
7
CarbonMonitor-Power near-real-time monitoring of global power generation on hourly to daily scales.CarbonMonitor-Power 对全球发电进行近实时监测,时间分辨率为每小时到每天。
Sci Data. 2023 Apr 17;10(1):217. doi: 10.1038/s41597-023-02094-2.
8
Near-real-time daily estimates of fossil fuel CO emissions from major high-emission cities in China.中国主要高排放城市化石燃料 CO 排放的近实时日估算。
Sci Data. 2022 Nov 10;9(1):684. doi: 10.1038/s41597-022-01796-3.
Sci Data. 2021 Nov 23;8(1):301. doi: 10.1038/s41597-021-01086-4.
4
China's city-level carbon emissions during 1992-2017 based on the inter-calibration of nighttime light data.基于夜间灯光数据的内校准,得到中国 1992-2017 年的城市级碳排放。
Sci Rep. 2021 Feb 8;11(1):3323. doi: 10.1038/s41598-021-81754-y.
5
Under-reporting of greenhouse gas emissions in U.S. cities.美国城市温室气体排放量少报。
Nat Commun. 2021 Feb 2;12(1):553. doi: 10.1038/s41467-020-20871-0.
6
Carbon Monitor, a near-real-time daily dataset of global CO emission from fossil fuel and cement production.碳监测仪,一个近乎实时的全球化石燃料和水泥生产二氧化碳排放逐日数据集。
Sci Data. 2020 Nov 9;7(1):392. doi: 10.1038/s41597-020-00708-7.
7
The Vulcan Version 3.0 High-Resolution Fossil Fuel CO Emissions for the United States.美国的“瓦肯3.0版”高分辨率化石燃料一氧化碳排放
J Geophys Res Atmos. 2020 Oct 16;125(19):e2020JD032974. doi: 10.1029/2020JD032974. Epub 2020 Oct 5.
8
Near-real-time monitoring of global CO emissions reveals the effects of the COVID-19 pandemic.近实时全球 CO 排放监测揭示了 COVID-19 大流行的影响。
Nat Commun. 2020 Oct 14;11(1):5172. doi: 10.1038/s41467-020-18922-7.
9
High resolution temporal profiles in the Emissions Database for Global Atmospheric Research.全球大气研究排放数据库中的高时间分辨率时间剖面。
Sci Data. 2020 Apr 17;7(1):121. doi: 10.1038/s41597-020-0462-2.
10
China CO emission accounts 2016-2017.中国二氧化碳排放清单研究报告 2016-2017
Sci Data. 2020 Feb 13;7(1):54. doi: 10.1038/s41597-020-0393-y.